Investment Company Institute Mutual Fund Data and ETF Money Flow:
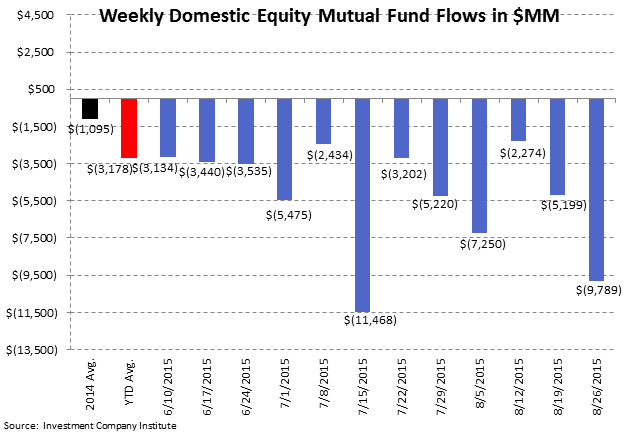
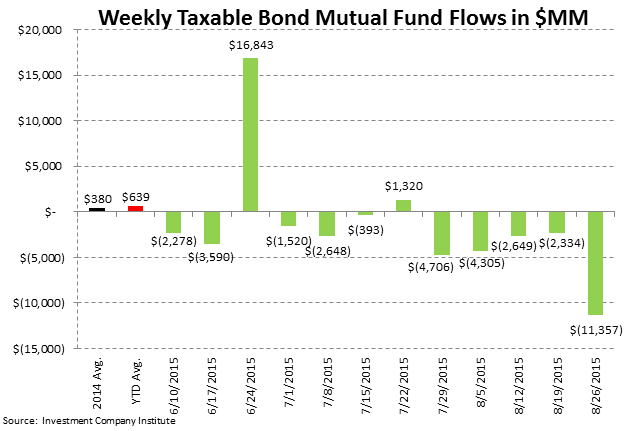
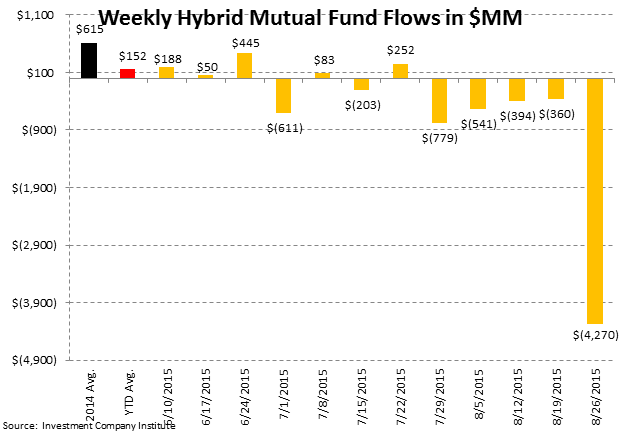
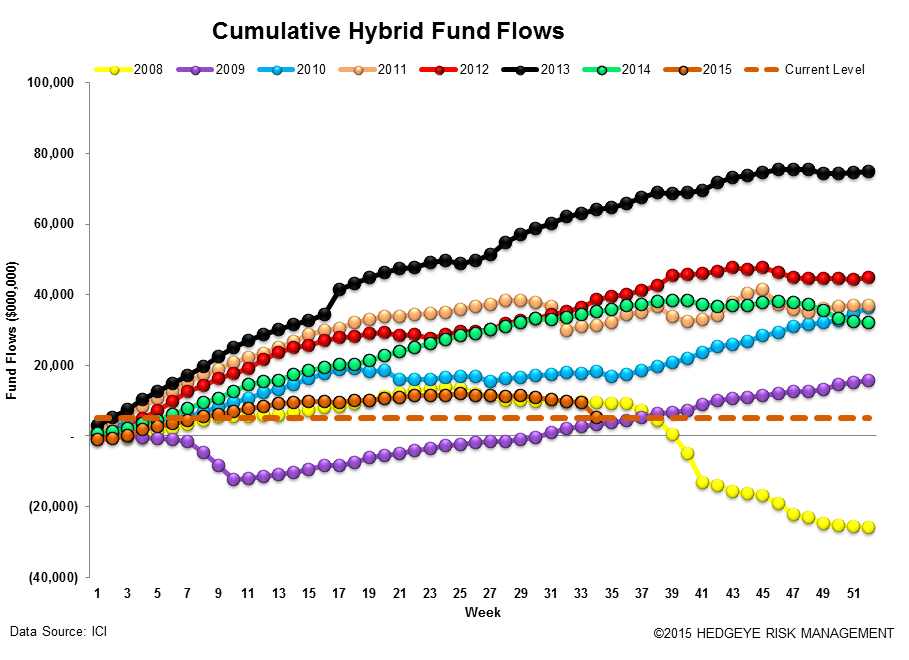
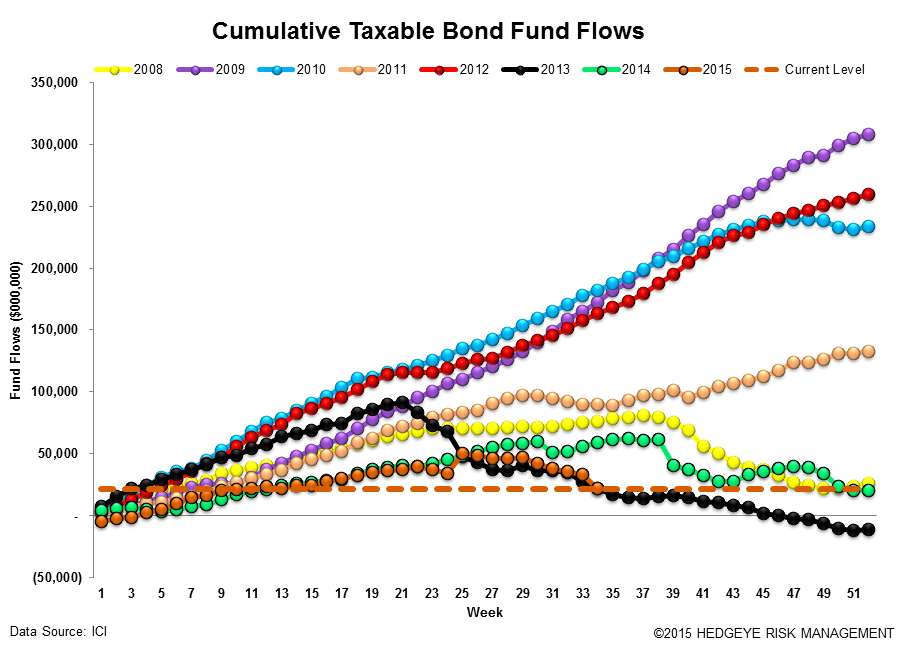
In the five days ending August 26th, investors pulled funds from every risk asset class on a net basis but shored up +$9 billion in money market funds on global market volatility. Taxable bond funds lost -$11.4 billion, their largest outflow in 47 weeks. Hybrid funds experienced an uncharacteristically large outflow of -$4.3 billion, the largest since November 16th, 2011. International equity funds, which had not experienced a weekly outflow all year, lost -$1.2 billion in the most recent 5 day period of the survey. Finally, as expected, the extreme market turbulence only strengthened the short case against the domestic equity managers, with domestic mutual funds losing another -$9.8 billion last week. The asset class has now lost a total of -$108.1 billion in 2015, the worst start to a 35 week period in the history of the ICI data. T. Rowe Price (TROW) stock with over 60% of its assets-under-management (AUM) in mutual funds and 85% of its AUM in domestic products continues to be our Short/Avoid proxy on these trends (see our TROW report HERE). Conversely, the +$9 billion build during the week into money funds has aggregated to +$79 billion in new cash/money funds quarter-to-date in 3Q15. This compares to the +$43 billion build for the entire 3rd quarter last year, so with still 4 weeks left in the 3Q15 operating period, our Best Ideas Long position in Federated Investors (FII) is experiencing solid fundamental trends in its core business (see our FII report HERE)

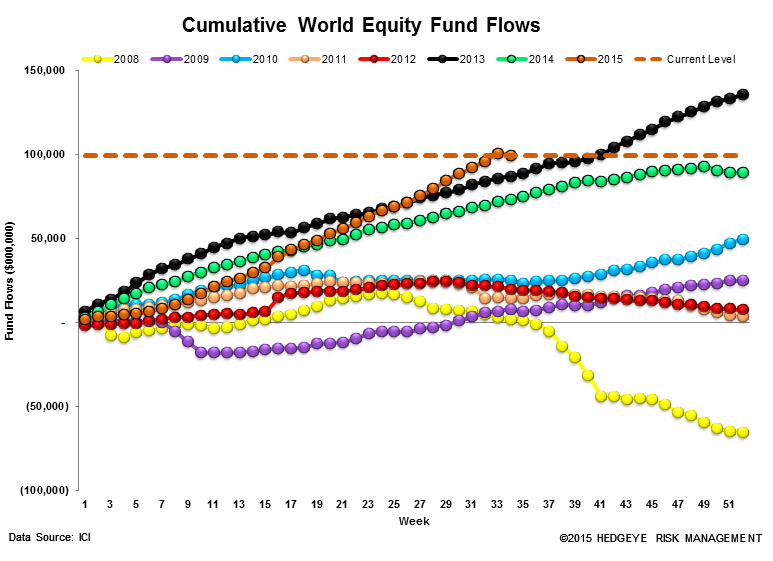
In the most recent 5-day period ending August 26th, total equity mutual funds put up net outflows of -$11.0 billion, trailing the year-to-date weekly average outflow of -$253 million and the 2014 average inflow of +$620 million. The outflow was composed of international stock fund withdrawals of -$1.2 billion and domestic stock fund withdrawals of -$9.8 billion. International equity funds have had positive flows in 47 of the last 52 weeks while domestic equity funds have had only 9 weeks of positive flows over the same time period.
Fixed income mutual funds put up net outflows of -$12.1 billion, trailing the year-to-date weekly average inflow of +$844 million and the 2014 average inflow of +$926 million. The outflow was composed of tax-free or municipal bond funds withdrawals of -$715 million and taxable bond funds withdrawals of -$11.4 billion.
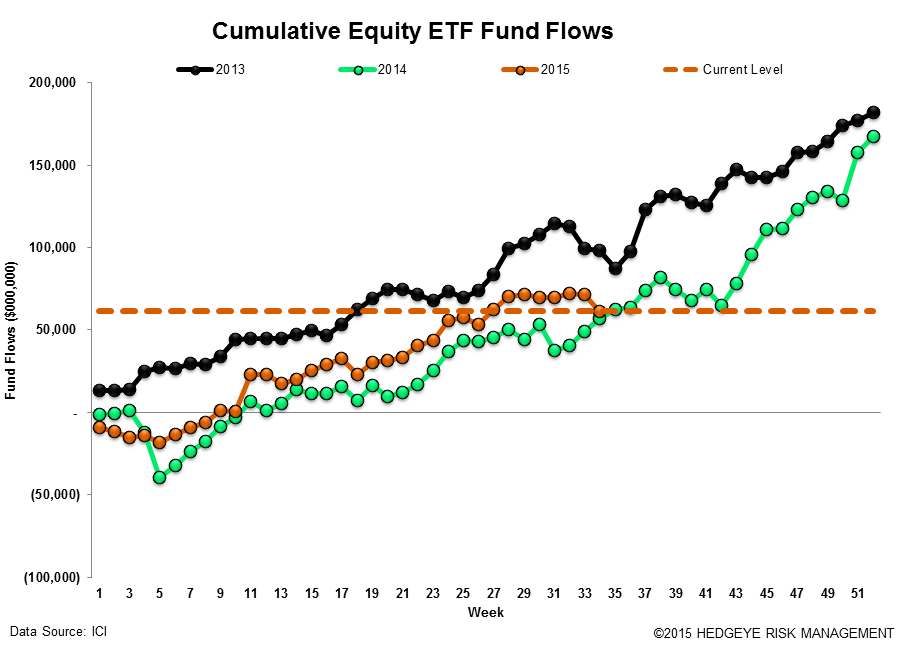
Equity ETFs had net redemptions of -$10.5 billion, trailing the year-to-date weekly average inflow of +$1.8 billion and the 2014 average inflow of +$3.2 billion. Fixed income ETFs had net inflows of +$1.7 billion, outpacing the year-to-date weekly average inflow of +$840 million and the 2014 average inflow of +$1.0 billion.
Mutual fund flow data is collected weekly from the Investment Company Institute (ICI) and represents a survey of 95% of the investment management industry's mutual fund assets. Mutual fund data largely reflects the actions of retail investors. Exchange traded fund (ETF) information is extracted from Bloomberg and is matched to the same weekly reporting schedule as the ICI mutual fund data. According to industry leader Blackrock (BLK), U.S. ETF participation is 60% institutional investors and 40% retail investors.
Most Recent 12 Week Flow in Millions by Mutual Fund Product: Chart data is the most recent 12 weeks from the ICI mutual fund survey and includes the weekly average for 2014 and the weekly year-to-date average for 2015:


Cumulative Annual Flow in Millions by Mutual Fund Product: Chart data is the cumulative fund flow from the ICI mutual fund survey for each year starting with 2008.


Most Recent 12 Week Flow within Equity and Fixed Income Exchange Traded Funds: Chart data is the most recent 12 weeks from Bloomberg's ETF database (matched to the Wednesday to Wednesday reporting format of the ICI), the weekly average for 2014, and the weekly year-to-date average for 2015. In the third table are the results of the weekly flows into and out of the major market and sector SPDRs:


Sector and Asset Class Weekly ETF and Year-to-Date Results: In sector SPDR callouts, investors continued to seek safety in the long treasury TLT ETF. The TLT took in +$275 million or +5% in contributions last week.

Cumulative Annual Flow in Millions within Equity and Fixed Income Exchange Traded Funds: Chart data is the cumulative fund flow from Bloomberg's ETF database for each year starting with 2013.

Net Results:
The net of total equity mutual fund and ETF flows against total bond mutual fund and ETF flows totaled a negative -$11.1 billion spread for the week (-$21.5 billion of total equity outflow net of the -$10.4 billion outflow from fixed income; positive numbers imply greater money flow to stocks; negative numbers imply greater money flow to bonds). The 52-week moving average is +$1.8 billion (more positive money flow to equities) with a 52-week high of +$27.9 billion (more positive money flow to equities) and a 52-week low of -$18.1 billion (negative numbers imply more positive money flow to bonds for the week.)

Exposures: The weekly data herein is important for the public asset managers with trends in mutual funds and ETFs impacting the companies with the following estimated revenue impact:

Jonathan Casteleyn, CFA, CMT
Joshua Steiner, CFA