

Our Hedgeye Housing Compendium table (below) aspires to present the state of the housing market in a visually-friendly format that takes about 30 seconds to consume.

Today's Focus: MBA Mortgage Applications & July Construction Spending
Resi Construciton Spending | New Highs = Historic Lows
The long-term mean reversion upside to new construction activity is about as conspicuous as it gets for a large-scale Macro factor.
Yesterday’s Construction Spending data showed both Total and Resi Construction spending made new post-crisis highs in July with private residential construction rising +1.1% MoM and accelerating to +15.6% YoY (along with the positive revision to 2Q data).
However, inclusive of the multi-year recovery, resi construction remains just 3.3% of GDP – a relative level associated with trough activity observed across 75 years of housing cycles. The 1st chart below serves as a simple but stark reminder of the current reality and secular opportunity.
A Note on the Housing Cycle: A somewhat obvious but seemingly underappreciated dynamic of the current cycle is that the recovery in housing lagged the broader macro inflection by more than two years. Given that housing was the final, pre-crisis beneficiary of an epic, multi-decade (policy) game of rotate-the-asset bubble, it’s not surprising that the subsequent recovery has been slow, choppy and broadly unimpressive.
However, Housing's unique role in precipitating and propagating the financial collapse also makes historical cycle precedents (in terms of housing's position in the temporal pattern of the archetypal cycle) less informative as an analog.
In short, while we’re late or mid-late cycle more broadly, we’re somewhere closer to early-mid or mid cycle in housing itself. The housing cycle and the economic cycle are, of course, not mutually exclusive but they can tread variant medium-term paths.
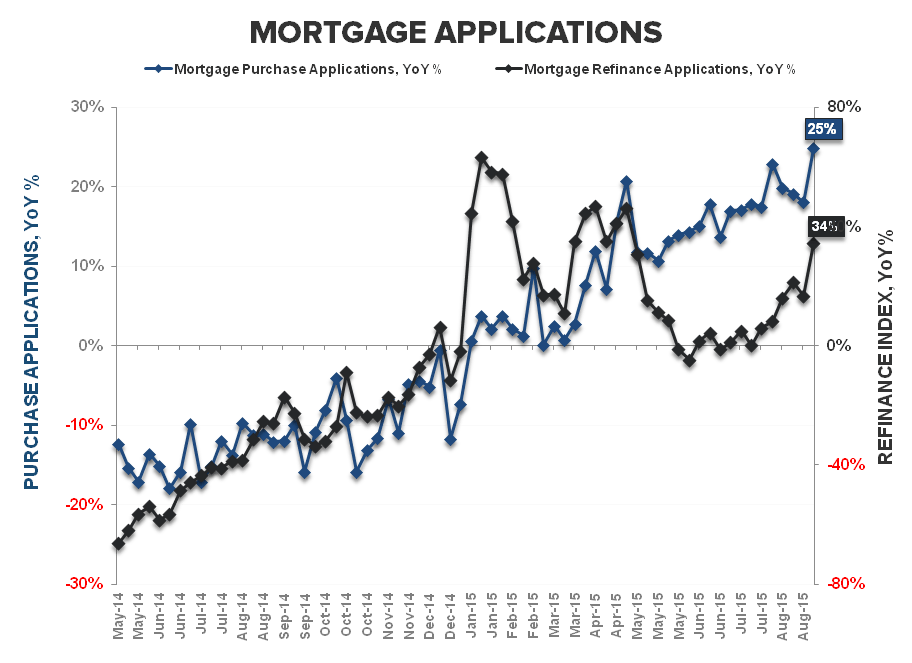
Purchase Apps | Rates Ebb, Volume Flows
The MBA’s high frequency purchase application data showed demand rising to close out (what had been) an uninspiring August. Purchase demand rose +4.1% WoW and accelerated to +24.8% YoY – the fastest year-over-year rate of growth YTD – and comps remain easy through the balance of 2H. On a QoQ basis, purchase activity is currently tracking -1.2% sequentially.
Rates on the 30Y FRM were static at 4.08% in the latest week, holding at 3-month lows. At current interest rates, affordability remains +4.2% better than the 2014 average and sits as a modest tailwind for HPI.


About MBA Mortgage Applications:
The Mortgage Bankers’ Association’s mortgage applications index covers more than 75% of mortgage applications originated through retail and consumer direct channels. It does not include loans delivered through wholesale broker and correspondent channels. The MBA mortgage purchase applications index is considered a leading indicator of single-family home sales and construction. Moreover, it is the only housing index that is released on a weekly basis.
Frequency:
The MBA Purchase Apps index is released every Wednesday morning at 7 am EST.
Joshua Steiner, CFA
Christian B. Drake
