

This research note was originally published August 27, 2015 at 08:22. If you would like more info on how you can access our institutional research please email sales@hedgeye.com.
Investment Company Institute Mutual Fund Data and ETF Money Flow:
Domestic equity funds continue their streak of outflows, now at 25 consecutive weeks with another -$5.2 billion reigned in by investors in the most recent 5 days. The table below shows all domestic equity outflow sequences greater than 4 consecutive weeks in data going back to 2008. We considered a streak of outflows broken by 4 weeks of consecutive inflows. Within these parameters, there have been 8 total outflow sequences with the mean lasting 40 weeks with $105 billion lost on average. The current sequence, as of August 19th, is only the 8th longest in weekly duration, but at -$101.0 billion in total outflows lost, it is the 4th largest in magnitude. With an average outflow of -$4.0 billion per week, the running 2015 outflow is fastest pace on record in our data back to '08.

In other products, intermediate trends continued with investors fleeing fixed income given worries over the direction of short-term interest rates. In the most 5 day period, investors pulled -$1.3 billion from total bond mutual funds and ETFs with these withdrawals continuing to fund international equity investments. This week international funds took in +$4.7 billion, their largest inflow since +$5.0 billion in the week ending April 18th, 2007.

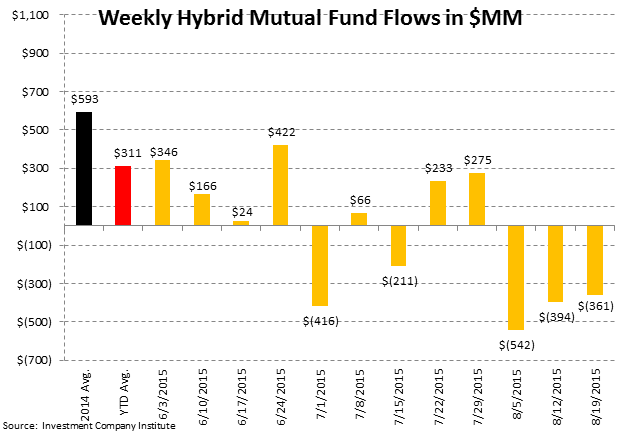
In the most recent 5-day period ending August 19th, total equity mutual funds put up net outflows of -$554 million, trailing the year-to-date weekly average inflow of +$70 million and the 2014 average inflow of +$620 million. The outflow was composed of international stock fund contributions of +$4.7 billion and domestic stock fund withdrawals of -$5.2 billion. International equity funds have had positive flows in 48 of the last 52 weeks while domestic equity funds have had only 9 weeks of positive flows over the same time period.
Fixed income mutual funds put up net outflows of -$2.3 billion, trailing the year-to-date weekly average inflow of +$1.2 billion and the 2014 average inflow of +$926 million. The outflow was composed of tax-free or municipal bond funds contributions of +$50 million and taxable bond funds withdrawals of -$2.3 billion.
Equity ETFs had net redemptions of -$238 million, trailing the year-to-date weekly average inflow of +$2.2 billion and the 2014 average inflow of +$3.2 billion. Fixed income ETFs had net inflows of +$968 million, outpacing the year-to-date weekly average inflow of +$814 million but trailing the 2014 average inflow of +$1.0 billion.
Mutual fund flow data is collected weekly from the Investment Company Institute (ICI) and represents a survey of 95% of the investment management industry's mutual fund assets. Mutual fund data largely reflects the actions of retail investors. Exchange traded fund (ETF) information is extracted from Bloomberg and is matched to the same weekly reporting schedule as the ICI mutual fund data. According to industry leader Blackrock (BLK), U.S. ETF participation is 60% institutional investors and 40% retail investors.
Most Recent 12 Week Flow in Millions by Mutual Fund Product: Chart data is the most recent 12 weeks from the ICI mutual fund survey and includes the weekly average for 2014 and the weekly year-to-date average for 2015:


Cumulative Annual Flow in Millions by Mutual Fund Product: Chart data is the cumulative fund flow from the ICI mutual fund survey for each year starting with 2008.


Most Recent 12 Week Flow within Equity and Fixed Income Exchange Traded Funds: Chart data is the most recent 12 weeks from Bloomberg's ETF database (matched to the Wednesday to Wednesday reporting format of the ICI), the weekly average for 2014, and the weekly year-to-date average for 2015. In the third table are the results of the weekly flows into and out of the major market and sector SPDRs:


Sector and Asset Class Weekly ETF and Year-to-Date Results: In sector SPDR callouts, investors contributed a massive +9% or +$448 million to the long treasury TLT ETF as they sought safety on Chinese and global growth concerns.

Cumulative Annual Flow in Millions within Equity and Fixed Income Exchange Traded Funds: Chart data is the cumulative fund flow from Bloomberg's ETF database for each year starting with 2013.


Net Results:
The net of total equity mutual fund and ETF flows against total bond mutual fund and ETF flows totaled a positive +$524 million spread for the week (-$792 million of total equity outflow net of the -$1.3 billion outflow from fixed income; positive numbers imply greater money flow to stocks; negative numbers imply greater money flow to bonds). The 52-week moving average is +$2.0 billion (more positive money flow to equities) with a 52-week high of +$27.9 billion (more positive money flow to equities) and a 52-week low of -$18.1 billion (negative numbers imply more positive money flow to bonds for the week.)

Exposures: The weekly data herein is important for the public asset managers with trends in mutual funds and ETFs impacting the companies with the following estimated revenue impact:

Jonathan Casteleyn, CFA, CMT
203-562-6500
Joshua Steiner, CFA
203-562-6500
