Our Hedgeye Housing Compendium table (below) aspires to present the state of the housing market in a visually-friendly format that takes about 30 seconds to consume.

Today's Focus: July Pending Home Sales & MBA Mortgage Applications
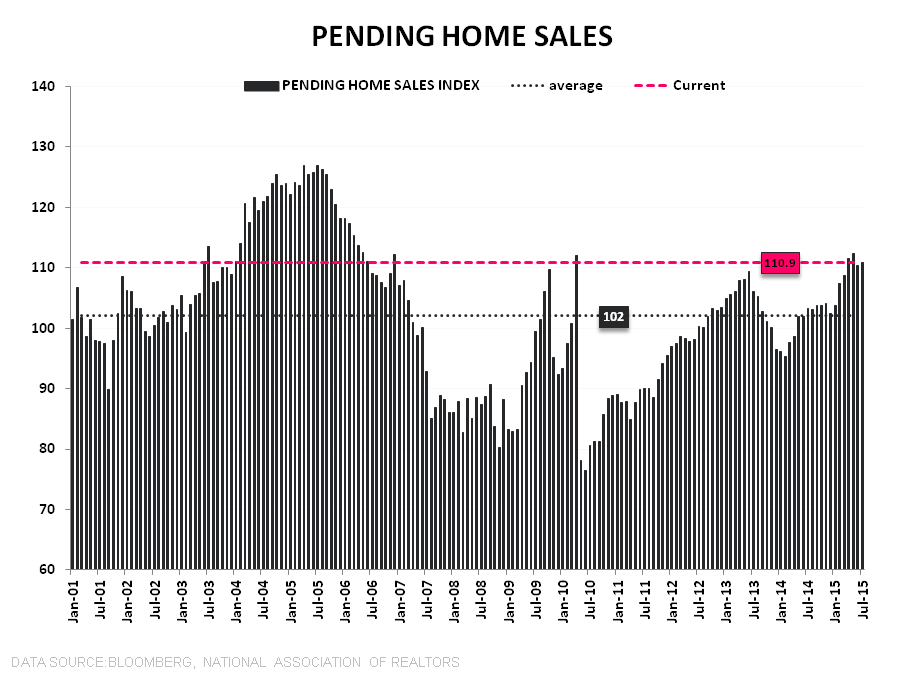
Pending Home Sales rose +0.5% sequentially in July following last month’s notable -1.7% retreat off the post-crisis highs recorded in May. On a year-over-year basis growth decelerated -100 bps sequentially to +7.4% YoY, marking a 3rd consecutive month of 2nd derivative slowing.
The takeaways are pretty straightforward:
- From Great to Good: In rate-of-change terms, growth in activity is slowing and that trend should continue as comps steepen considerably through the balance of the year (see charts 2/3 below).
- EHS Downside: PHS is a strong leading indicator for EHS and the prevailing tendency has been for EHS to re-couple in favor of PHS following short-term dislocations. PHS softness in June and today’s uninspiring print for July suggest downside risk to reported EHS over the next month or two (see 1st chart below).
- Purchase App Corroboration: The recent trend in Purchase Applications has been similarly lackluster. Inclusive of the +1.7% gain in the latest week, Purchase Demand is tracking -2.4% MoM in August and -1.6% QoQ for 3Q.
- New vs Existing: New and Existing Sales face similar (i.e. tougher) comp dynamics over 2H15 but, given where each is in their respective cycle, the MT/LT opportunity for new construction activity remains more compelling. The mean reversion opportunity to average levels of activity in the new home market is ~20% while it's modestly negative in the existing market. Upside to 6.0MM or greater in EHS is reachable (from 5.59MM last) but would require full market normalization and full resurgence in 1st-time buyer share to average historical levels.
- Rates: Rates remain the lead swing factor for the complex and while rampant rate volatility has characterized most of the YTD, the expedited rate retreat over the last month has supported the relative case for domestic housing leverage. At 3.83% on the 30Y FRM, affordability remains +4.5% better than the 2014 average and sits as a modest tailwind for HPI.


About Pending Home Sales:
The Pending Home Sales Index is a monthly data release from the National Association of Realtors (NAR) and is considered a leading indicator for housing activity in the US. It is a leading indicator for Existing Home Sales, not New Home Sales. A pending home sale reflects the signing of a contract, but not the closing of the transaction, which occurs 1-2 months later. The NAR uses data from the MLS and large brokers to calculate the Pending Home Sales index. An index value of 100 corresponds to the average level of activity during 2001.
Frequency:
The NAR Pending Home Sales index is released between the 25th and the 31st of each month and covers data from the prior month.
About MBA Mortgage Applications:
The Mortgage Bankers’ Association’s mortgage applications index covers more than 75% of mortgage applications originated through retail and consumer direct channels. It does not include loans delivered through wholesale broker and correspondent channels. The MBA mortgage purchase applications index is considered a leading indicator of single-family home sales and construction. Moreover, it is the only housing index that is released on a weekly basis.
Frequency:
The MBA Purchase Apps index is released every Wednesday morning at 7 am EST.
Joshua Steiner, CFA
Christian B. Drake