We don’t like TIF into the print as we think 1) back half numbers look too high, and 2) this model is extremely poorly positioned for the consumer climate we’re forecasting. There are definitely redeeming qualities about the name – most notably the Brand (and that’s pretty much it). But it is trading near a peak multiple (18.5x) on peak margins (21%), peak earnings ($4.24E), peak returns (18%), has the worst cash conversion cycle we’ve ever seen (490 days), while sentiment is sitting at all-time highs. It’s feast or famine – if one of those metrics breaks, then they all do.
Common perception seems to be that “just because TIF blew up earlier this year, it can’t blow up again.” We simply disagree. The environment has changed significantly, and the company’s guidance for back half growth “in the double digits” is not going to happen. Could the company grow earnings in the 4-6% range? Yes. It can. But that implies at least a $0.15 guide down. Importantly, that could/should cause the consensus to revisit its $4.75 estimate for next year, which we don’t think is achievable. We think a base case is $4.50, with downside to $4.00 as the macro environment worsens.
Historically, TIF’s multiple change has been fairly explosive. As you can see, when earnings have been revised meaningfully up or down, we’ve seen TIF’s multiple relative to the S&P move by up to 40%. The point is that a $4.00 earnings number won’t get a high-teens multiple. It will get something in the low teens while the market waits for earnings to find a bottom. Using that logic, it is not unrealistic to model a $50 stock -- $30 lower. Are we making a call right now for such severe downside? No, we’re not. But that’s where the research initially appears to be headed.

Mother Macro Could Make $4.00 (or less) A Reality?
Consider the following… Domestic economic growth is now well past-peak in rate-of-change terms for this economic expansion, with US GDP growth getting tougher in the 2nd half of 2015 vs. the 1st half. That means, if you held all other risks equal, the probability is higher that growth slows in Q3 and Q4 than Q2. And the last two cycle tops didn’t have this mother of all demographic secular slowings – and note that this isn’t just the US -- the chart below represents better than 90% of Tiffany’s earnings.

Modeling Considerations
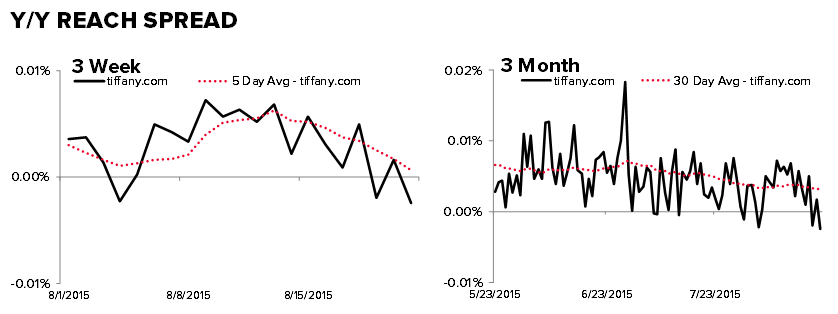
2Q: Overall, 2Q looks ok to us. Street estimates imply a slowdown in the 2 year constant currency comp by ~200bps. That seems fair. LVMH and Kering both noted rebounds in jewelry sales in their second quarters. Additionally, TIF's comp has directionally followed the organic growth of LVMH watch and jewelry sales for the past 4 quarters. A potential positive is the Tiffany T collection which could/should boost penetration of the higher margin gold/silver fashion product. TIF’s US e-commerce business implies healthy demand in 2Q – though the trends look problematic into 3Q. It’s only 6% of TIF’s business, but is a good barometer for overall demand. Furthermore, TIF’s SIGMA chart looks very bad. Inventories are out of whack with the P&L in a way that is unlikely to be a 1-quarter fix without a meaningful margin event.

Back Half
Here’s where we think the problem lies. Comp estimates are reasonable against easy compares, but Q3 margin comp is toughest of the year (even worse on 2 year rate). SG&A growth was just 1% in Q4 last year, yet the street looking for SG&A leverage in this Q4 as the company despite the company putting more capital into its new watch collection and "Will You" engagement campaign. FX pressure is likely to ease in Q4, but what helps revenue and GM will hurt SG&A. The Street has 11% EPS growth in Q3 and Q4. We see it more as flat Q3 and HSD Q4.

![]()