

Our Hedgeye Housing Compendium table (below) aspires to present the state of the housing market in a visually-friendly format that takes about 30 seconds to consume.

Today's Focus: July New Home Sales & June Case-Shiller HPI
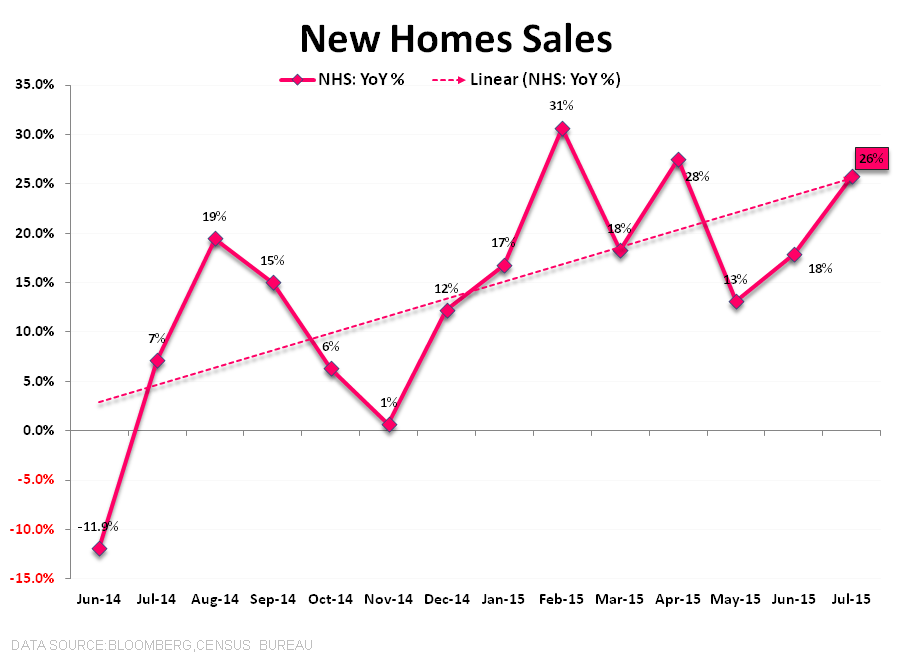
New Home Sales: NHS in July retraced last month’s dud, rising +5.4% MoM and accelerating to +26% YoY. As we’ve highlighted previously, and as the 1st chart below illustrates, July represented a quirky month from a comp perspective. Year-over-year comps begin to steepen considerably in 3Q (July comp =+7% vs June = -12%) but the sequential was easy given last month’s retreat and, on an absolute basis, July 2014 represented the lowest level of sales in 2-years.
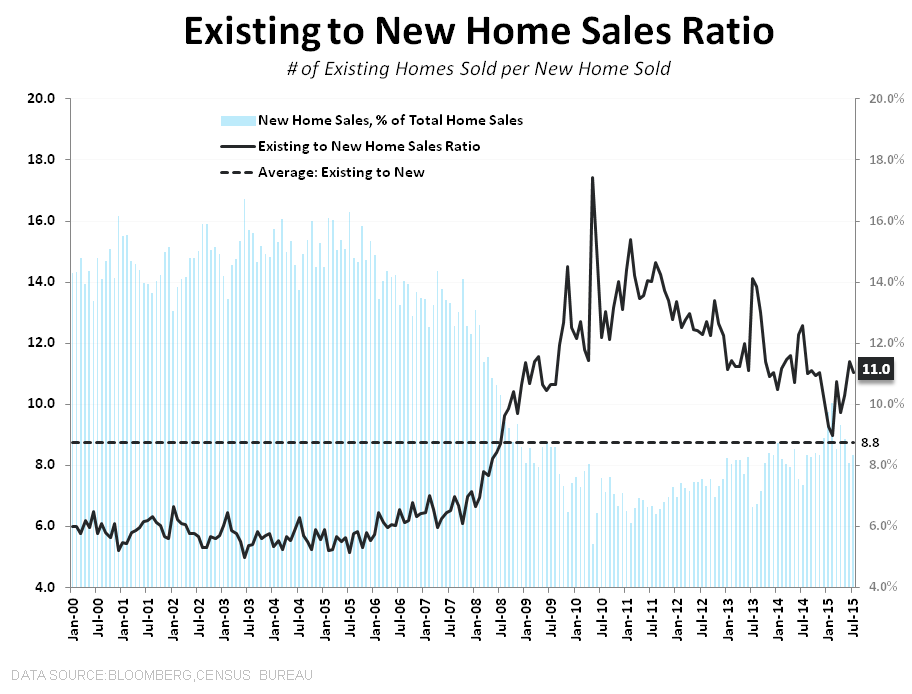
Geographically, sales rose sequentially across all regions except the Midwest while year-over-year sales growth was positive across all geographies with growth of +39% and +29% in the Northeast and West, respectively, leading the gains. As a percentage of the total market, New Home share rose to 8.3% in July from 8.1% in June (LT average = ~11.4%) as existing sales made another post-crisis high in the latest month.
On the supply side, the inventory of new homes rose 3.8% month-over-month to 221K on a unit basis while decelerating -80 bps sequentially to +7.3% YoY.
Summarily, in the immediate-term the comp setup for NHS is less favorable while the longer-term mean reversion opportunity in the New Home Market remains both conspicuous and favorable relative the magnitude of upside available in the existing market. Further, in a global environment characterized by price deflation and 0% +/- growth, a deceleration to low-teen’s sales growth may indeed be the Cyclops in a blind Macro land.
HPI: Concentrated Deceleration vs Diffuse Gain, Month 2
The Case-Shiller 20-City HPI for June released this morning – which represents average price data over the April-June period – showed home prices declining -0.12% MoM while holding flat at +4.9% year-over-year. For a second month, all 20 cities reported sequential increases on an NSA basis while, on an SA basis, 10-cities reported declines. Performance by City along with associated city index weightings is illustrated in the scatterplots below
Notably, and also for the 2nd consecutive month, the 20-city series and the National HPI (which covers all U.S. Census divisions ) have shown divergent, albeit modest, 2nd derivative trends. Whereas the 20-city series showed modest deceleration, the National HPI showed modest acceleration. This dynamic stems largely from the index weighting methodology and the fact that index heavyweights New York, San Francisco and Chicago all showed MoM declines and sequential YoY deceleration.
The deceleration in the 20-city series also stands in contrast to both the CoreLogic HPI for June and the multi-month trend in the FHFA HPI series which continue to reflect accelerating price growth. As it stands, we remain inclined to side with the CoreLogic/FHFA data as it's more leading and accords with the rising demand, tightening supply dynamic prevailing currently.
In our view, the more important release will be next week’s CoreLogic data for July along with the short-term projection for August.


About New Home Sales:
Each month the Census Department releases the New Home Sales report, which measures the number of newly constructed homes that have been sold in the month. The difference between the New Home Sales report and the Starts and Permits report is that New Home Sales only includes single family spec homes built and sold by builders, and does not include condos, apartments, or owner-built units. This is why New Home Sales typically run at roughly half the rate of Starts.
About Case Shiller:
The S&P/Case-Shiller Home Price Index measures the changes in value of residential real estate by tracking single-family home re-sales in 20 metropolitan areas across the US. The index uses purchase price information obtained from county assessor and recorder offices. The Case-Shiller indexes are value-weighted, meaning price trends for more expensive homes have greater influence on estimated price changes than other homes. It is vital to note that the index’s printed number is a 3-month rolling average released on a two month delay.
Frequency and Release Date:
The S&P/Case-Shiller HPI is released on the last Tuesday of every month. The index is on a two month lag and therefore does not reflect the most recent month’s home prices.
Joshua Steiner, CFA
Christian B. Drake
