This is an excerpt and chart featured in today's Early Look by Hedgeye CEO Keith McCullough. Please do not subscribe if you enjoy settling for lousy, consensus market and economic research which periodically blows investors up into smithereens.
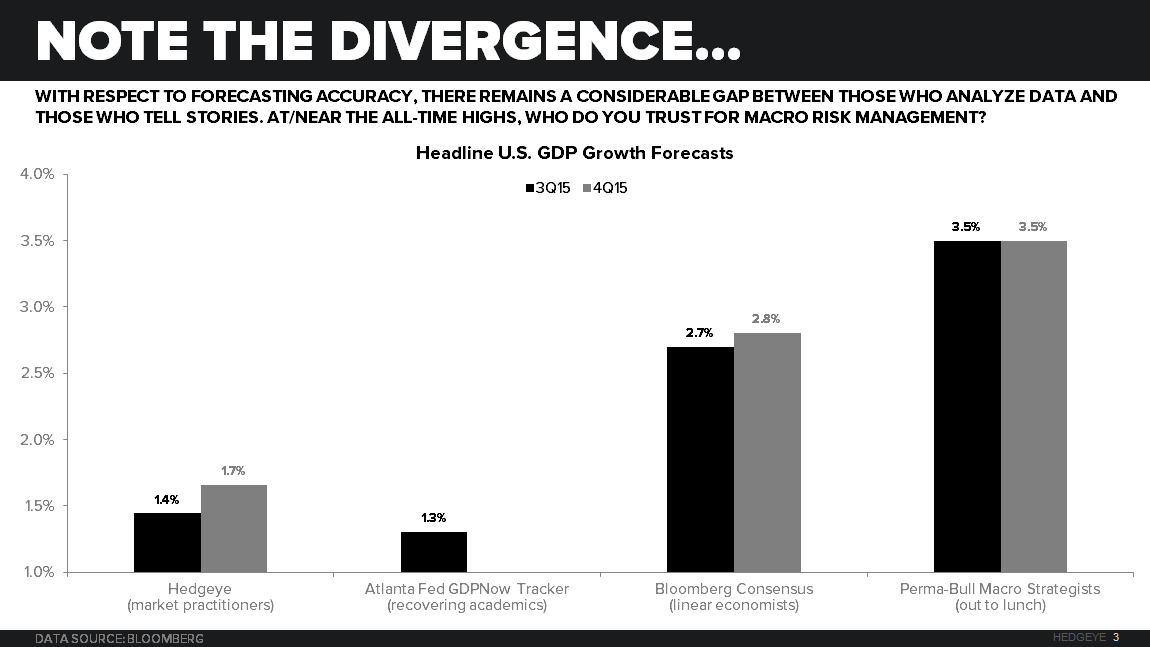
...[W]hat does it mean when the entire edifice of central-planning and those that market asset management at its alter are promising 2x the baseline growth (GDP) that is actually occurring? *reminder, Hedgeye is at 1.4% q/q SAAR and 1.6% y/y
Every single perma-bull economist/strategist in the US has not only a “3-4% US GDP” forecast in the 2H of 2015, but has it mapped in excel as far as the linear-seeing-eye can fathom, into 2016 and beyond.
That, to put its duration in historical context, implies the greatest economic expansion since WWII. And I’m thinking less American realists sign up to come fight for an un-elected central planning war today than they did for The People back then.