

Our Hedgeye Housing Compendium table (below) aspires to present the state of the housing market in a visually-friendly format that takes about 30 seconds to consume.

Today’s Focus: July Housing Starts & Permits and August NAHB HMI (Builder Confidence Survey)
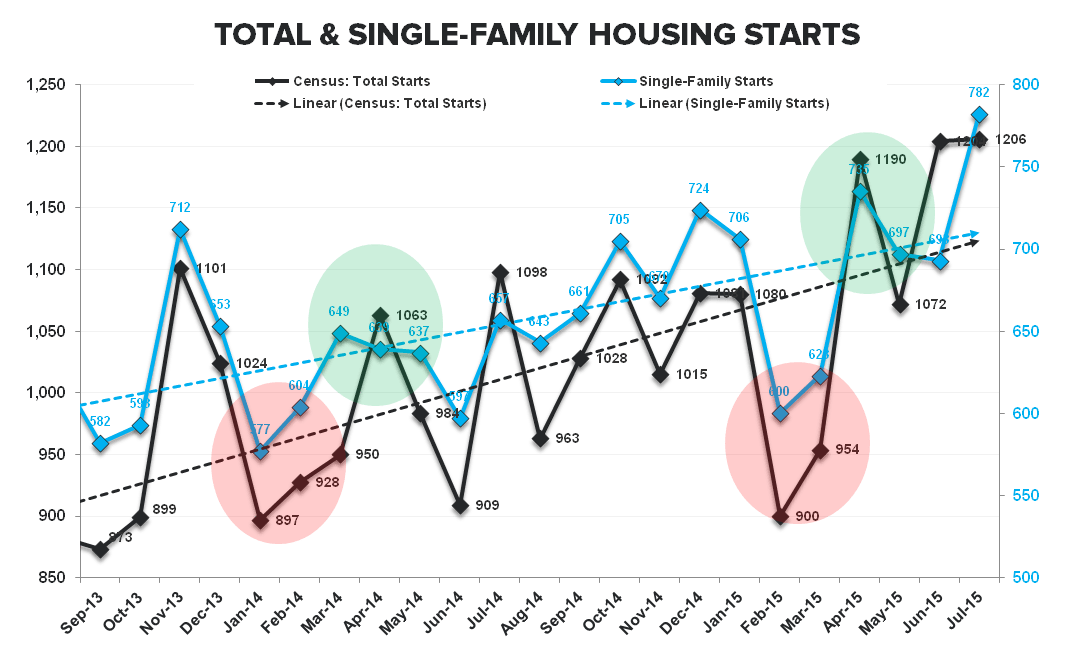
The hangover in permits in July following the NY tax exemption pull-forward was acute. The notable gain in SF Starts offset the MF disappointment, continuing the trend of organic improvement and further supporting the crawling but durable nature of the recovery
The 10-year high in builder confidence recorded in yesterday’s HMI print for August found positive confirmation in the July Starts data with single-family starts rising +12.8% MoM to +782K – the strongest level of new SF construction activity since December 2007. Permits were less remarkable, declining -1.9% MoM (+6% YoY).
On the multi-family side, Starts and Permits declined -17% and -32%, respectively, as the hangover from the May/June pull-forward in MF permitting in New York State ahead of the impending tax exemption expiry was fully manifest in the July figures. State level permits data is released on a 1-month lag but the NY impact is reflected in the regional data which is released alongside the headline figures. Indeed, Multi-family Permits in the Northeast declined -74% sequentially, falling from 234K in June to 61K in July.
On net, today’s release was a positive for the housing complex as the upside strength in single-family starts probably trumps the decline in permits which the market had begun to (under) discount the last couple weeks (consensus had ratcheted down permit expectations to 1217K, -9% MoM). Looking ahead to the Existing Market - where mean reversion back to average levels of activity has already occurred - we’ll get the EHS data for July on Thursday where weakness in Pending Sales in the latest month and flat-to-down trends in Purchase Application activity augur sequential softness in existing sales. We’d view the consensus expectation for a -1.2% retreat in EHS as ballpark correct.


About Housing Starts & Permits:
The US Census Bureau records the number of new housing units that have obtained permits for construction and those that have begun construction. This data includes new buildings intended primarily as residential units. The US Census Bureau defines a start as, “Start of construction occurs when excavation begins for the footings or foundation of a building.”
About the NAHB HMI:
The Housing Market Index (HMI) is based on a monthly survey of NAHB members designed to take the pulse of the single-family housing market. The monthly survey has been conducted for 30 years. The survey asks respondents to rate market conditions for the sale of new homes at the present time and in the next 6 months as well as the traffic of prospective buyers of new homes. The HMI is a weighted average of separate diffusion indices for these three key single-family series. The HMI can range from 0 to 100, where a value over 50 implies conditions are, on average, improving, a value below 50 implies conditions are worsening, and an index value of 50 indicates that the housing market is neither improving nor worsening.
Joshua Steiner, CFA
Christian B. Drake
