“It’s a messy process that involves doing a few things at once.”
-Patrick Lencioni
That was a solid leadership quote from a popular book I’m flipping through called The Advantage – “Why Organizational Health Trumps Everything In Business.”
Cheesy? Yes. Hence the flipping! But with the summer of 2015 coming to an end, I’m clearing my book shelf for what should be a scintillating September. Infrequently in my career have both complacency and short interest been so high.
Complacency: yesterday’s Total US Equity Market Volume (including dark pool) continued to crash (-26% vs. its 1yr average). Short Interest? I’ll get into how I look at that in the grind.

Back to the Global Macro Grind…
But first, since I’m getting back into the swing of things this morning, allow me to review a few critical #process points that make my risk management conclusions less messy:
- VOLUME – when price is rising on A) decelerating volume and B) rising volatility, that’s bearish
- OPTIONS – one key way we measure “short interest” is via non-commercial futures and options contracts
It’s taken me almost 17 years to refine the price/volume/volatility signal – and while I continue to refine it (and will until I retire), I feel as good as I’ve ever felt about our ability to #FadeBeta.
“Fading beta” means (sometimes) taking the opposite side of a market’s daily direction. This typically happens (in Real-Time Alerts) when PRICE is hitting either the low or high end of my immediate-term TRADE risk range.
You can also “fade options” activity by measuring the z-score of Global Macro positions. What I mean by that is buying/covering a market when A) PRICE = low-end of the range and B) the net SHORT position = high end of its range.
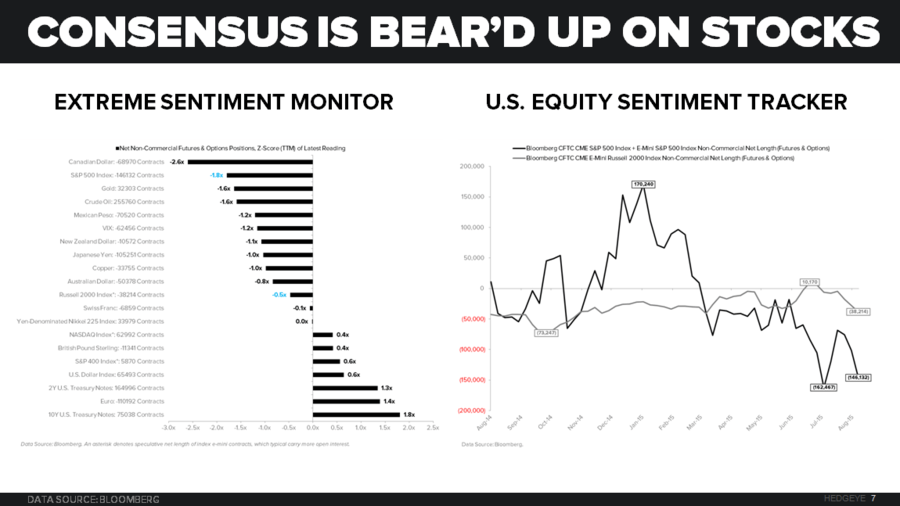
If you did that in US Equities (at last week’s lows), well done. Here’s how the net SHORT positions piled up:
- SP500 (index + Emini) net SHORT position was -146,132 contracts (that’s a 1yr z-score of -1.79x)
- Russell 2000 net SHORT position was -38,214 contracts (that’s a 1yr z-score of -0.47x)
In other words, after growth, inflation, revenue/earnings, etc. data slowed (at an accelerating rate both locally and globally) in July, US stocks corrected, and Consensus Macro players got shorter, lower, instead of getting longer.
Then, the no-volume (squeeze) bounce. And voila!
Inclusive of the Russell 2000 bouncing +1.6% off that 1205 AUG low last week (it was -7% from its YTD high prior to the bounce), last week’s US stock market bounce featured Style Factors that had been leading the market lower for a month:
- LEVERAGE – High Debt/Enterprise Value Stocks were +1.2% after being -3.6% in the month prior
- BETA – High Beta Stocks (another style factor) were +1.0% after being -5.6% in the month prior
And you saw some no-volume follow through on the same yesterday as well with High Beta Biotech (IBB) Stocks leading the day at +2.1% as the Russell 2000 added 1.0% to that bounce from 1205 to 1225.
But what’s next?
Well, if high-debt-leverage to commodity #Deflation and high-beta levered to too-high-growth-expectations got Consensus Macro run over after chasing their May-June 2015 highs, I think we have to ask ourselves what’s changed this morning?
In perpetually monitoring that, the Top 3 Things in my notebook this morning are as follows:
- CHINA – after telling the world “volatility in the Chinese stock market is over”, central planners got tagged with a -6.2% drop in the Shanghai Comp overnight – while mainstream isn’t on this, the rest of Asia is slowing, faster, too – in the last month: Taiwan -9.6%, Singapore -8.8%, Thailand -8.3%, Indonesia -7.0%, South Korea -5.8%
- #DEFLATION – “reflation” (and high beta, high leverage, style factors) helped stocks bounce off last Wednesday’s lows, but are right back in the soup this morning with both WTI (Oil) and Copper making fresh 3-month lows
- UST 10YR – yield of 2.14% this morning does the round trip (from June) – so what Mr. Macro Market is telling you is that even if the Fed does hike into a Q3 slowdown, probability is rising that growth and inflation slows faster in Q4!
Yes, my #process involves doing more than a few things at once. It’s taken me a long time and a lot of mistakes to get it to where it is now. No, it’s not perfect. But it sure beats the messy macro “process” of chasing charts (i.e. last price).
Our immediate-term Global Macro Risk Ranges are now:
UST 10yr Yield 2.10-2.20%
SPX 2071-2109
RUT 1198-1231
Oil (WTI) 41.04-43.58
Copper 2.28-2.38
Best of luck out there today,
KM
Keith R. McCullough
Chief Executive Officer