
With WTI moving in on its oversold signal, we want to book some gains short-side and outline a few upcoming catalysts that could disrupt our view (which hasn’t changed) through the end of the year.
Our intermediate-term view of 1) more deflationary USD strength and 2) Confirming market signals (PRICE, VOLUME, VOLATILITY) drives our bearish view on commodities as an asset class. With that being said, many of the tickers on our screen look oversold (Crude oil included) on the FX catalyst this week and we want to point out a few snap back risks over the next month and a half (think of them as shorter-term risks within an intermediate-term TREND view on the asset class).
With WTI moving to the bottom end of our risk range we like the idea of booking some gains short-side with the intention of re-shorting at a better price. Since the reflation trade unwind (June 10th), the market signaling taking crude lower confirms our intermediate-term TREND bias but these signals haven’t been as strong over the last two weeks.
- Implied volatility (OVX Index) has moved higher with widening realized ranges. Higher volatility increases the range of probable outcomes near term
- The healthy volumes and greater price semi-deviation on the down days (Target threshold of “0%”) confirm the bearish momentum over the last month and a half but these signals too, aren’t as strong
- Consensus now expects more USD strength and pain in commodities as relative USD correlations have broken down over the last month

The table above shows that on days of negative returns since the June 10th highs (which double up down days), we’ve seen healthy volumes and more variance in price momentum (All BEARISH signals) meaning that the downside moves have been much more pronounced on average.
Most importantly, these price signals haven’t been as pronounced over the last two weeks, and currency correlations (both absolute and relative) are breaking down as expected volatility widens out: NON-LINEAR RISK.

WIDENING RANGES: Realized Ranges and expected volatility stretching out

Source: Bloomberg
We outlined both of the next two central planning catalysts in the Macro Show this morning:
“$USD: Investors pushed out the dots yesterday as global growth slowing and China’s quasi-acknowledgement of economic reality pushed bets on the probability of a September lift-off back below 50% and pushed the dollar -1.1% lower on the day. As a consequence XLE pop +1.86% to lead sector performance. Jackson Hole is the next currency catalyst, and we expect the event to be Euro bearish with Draghi’s presence. Jackson Hole = Aug 27-29th, September FOMC = Sept 17th.”
With the 2-step Chinese devaluation and likely Draghi jawboning in Jackson Hole perpetuating a de-facto tightening without a fed funds rate cut, any incrementally dovish move out of the Fed could unwind consensus positioning which is betting on more of the same:


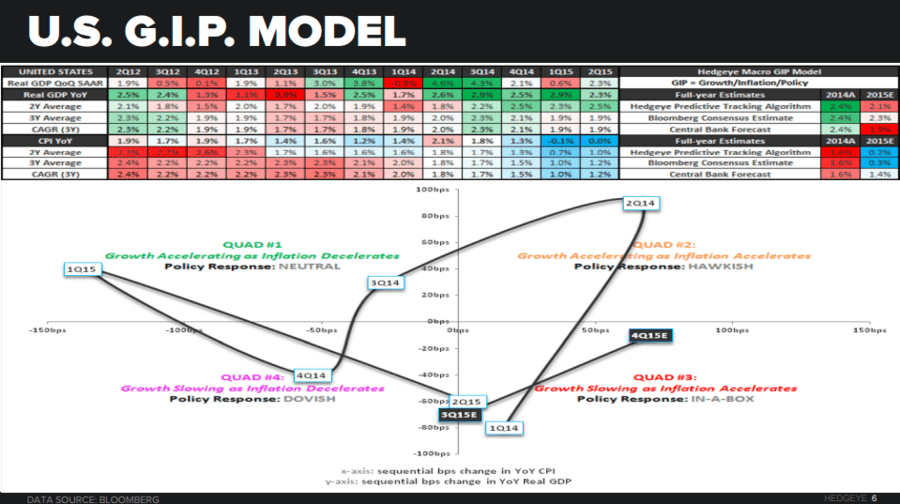
The most differentiated part of our GIP model right now for the full year 2015 is our inflation estimates (See below). With the relative central policy measures globally perpetuating more USD strength, expect a pushing of the dots (or an expected pushing of the dots) if the Fed starts to sniff out CPI readings anywhere in our area code ahead of the September meeting. Even so, Draghi is the near-term catalyst (unless we get more from Beijing), but the market is sniffing him out.
Ben Ryan
Analyst
