

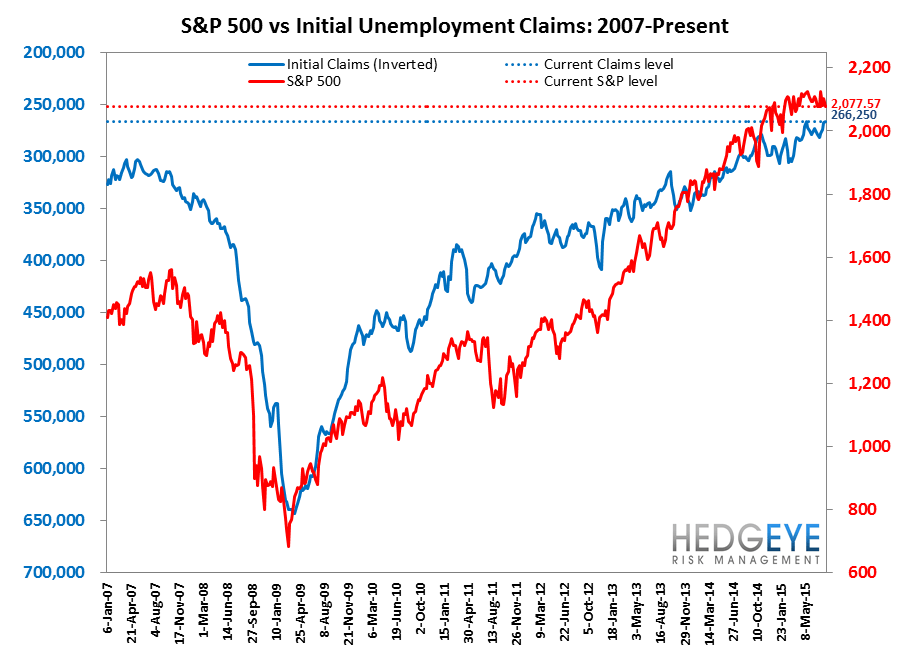
With spot SA claims having hit a 42-year low four weeks ago, the rolling 4-week number has hit its own low of 266.3k this week. The last time rolling SA claims were at this level was the week ending April 15, 2000. Aside from that one week in 2000, this is the lowest level of rolling SA claims since December 1973.
For perspective, back in the late '90s, early '00s cycle, 266.3k was the lowest rolling SA claims would go. The following chart shows that from April 15, 2000 claims began to rise; the economy entered recession exactly one year later.

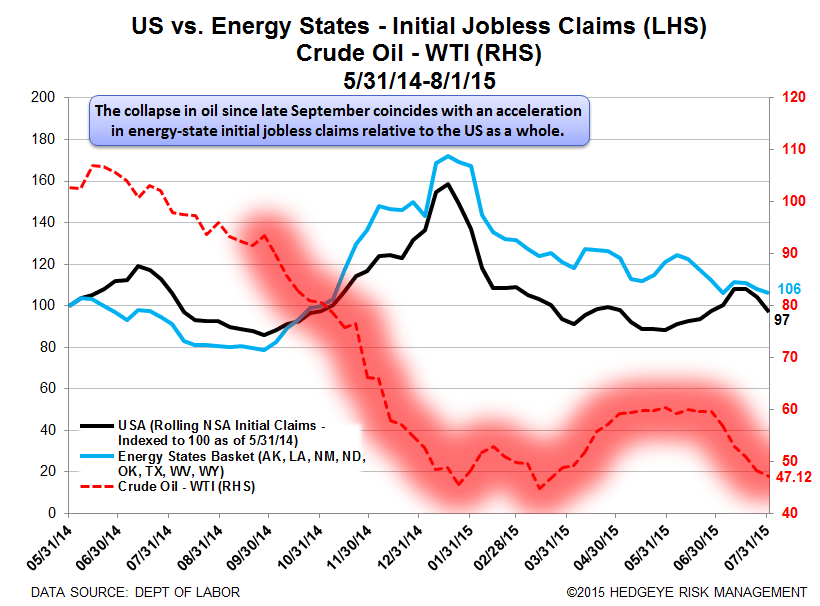
In energy states, the spread versus the U.S. as a whole rose to 9 in the week ending August 1, coinciding with the July Challenger report that showed Energy sector cuts rising to 9k from 0k in June.
The Data
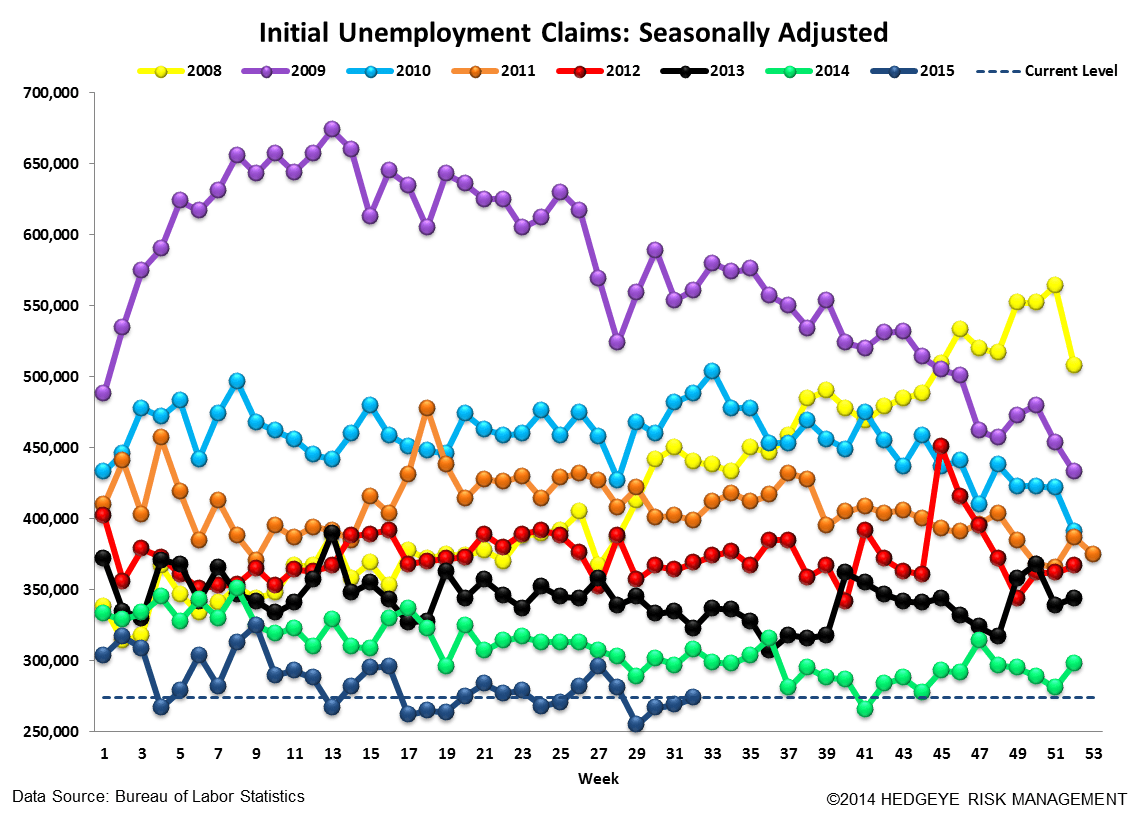
Prior to revision, initial jobless claims rose 4k to 274k from 270k WoW, as the prior week's number was revised down by -1k to 269k.
The headline (unrevised) number shows claims were higher by 5k WoW. Meanwhile, the 4-week rolling average of seasonally-adjusted claims fell -1.75k WoW to 266.25k.
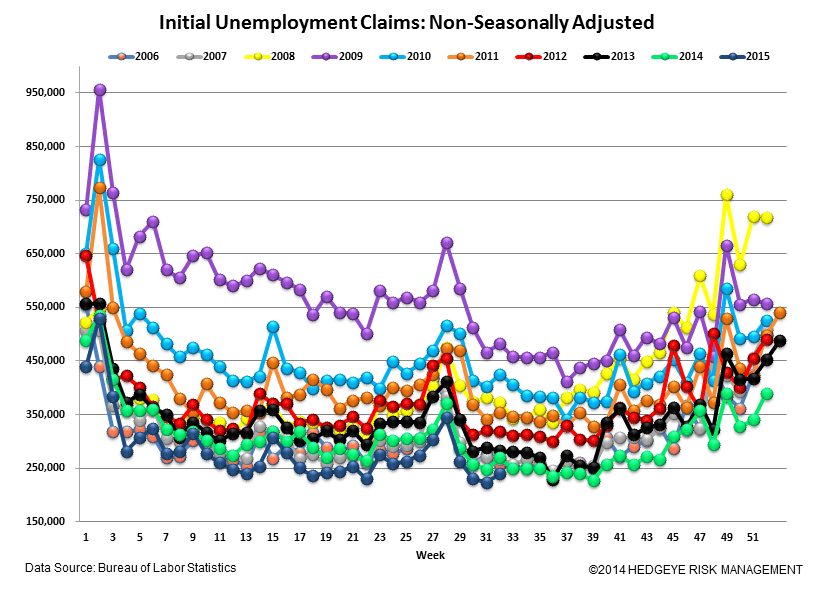
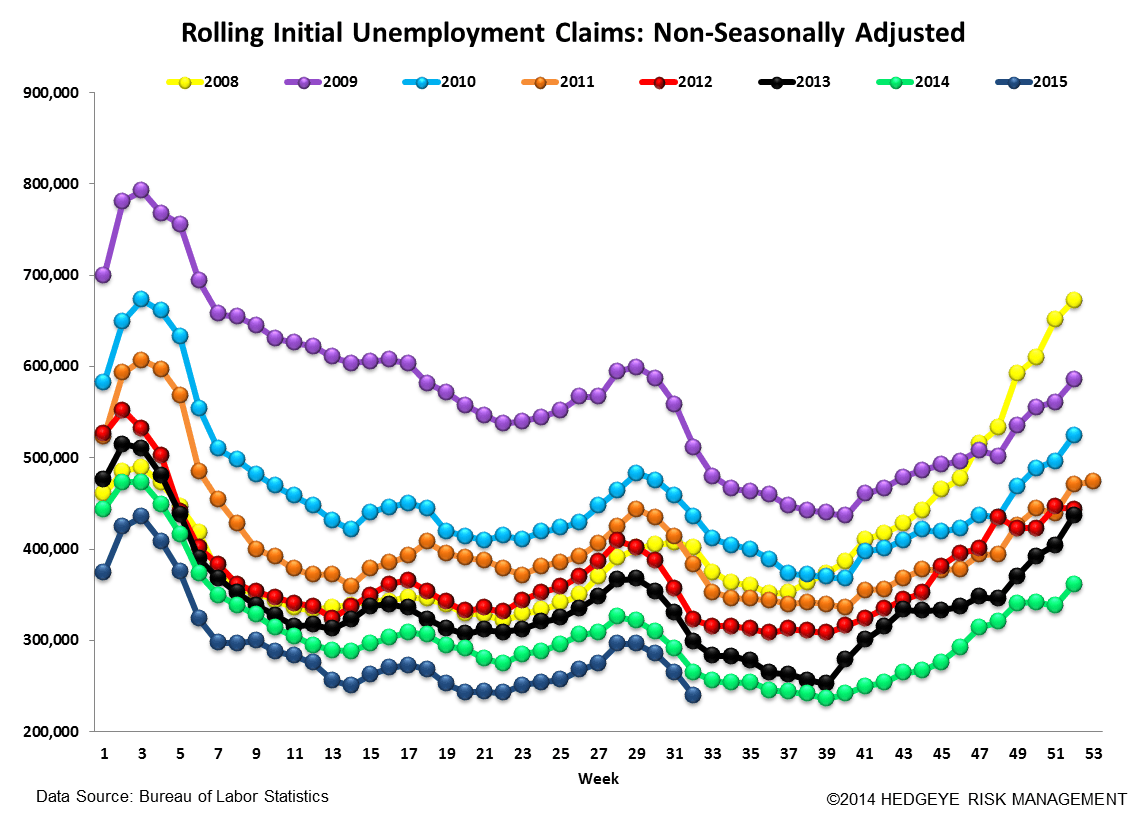
The 4-week rolling average of NSA claims, another way of evaluating the data, was -9.9% lower YoY, which is a sequential improvement versus the previous week's YoY change of -8.7%
<chart2>


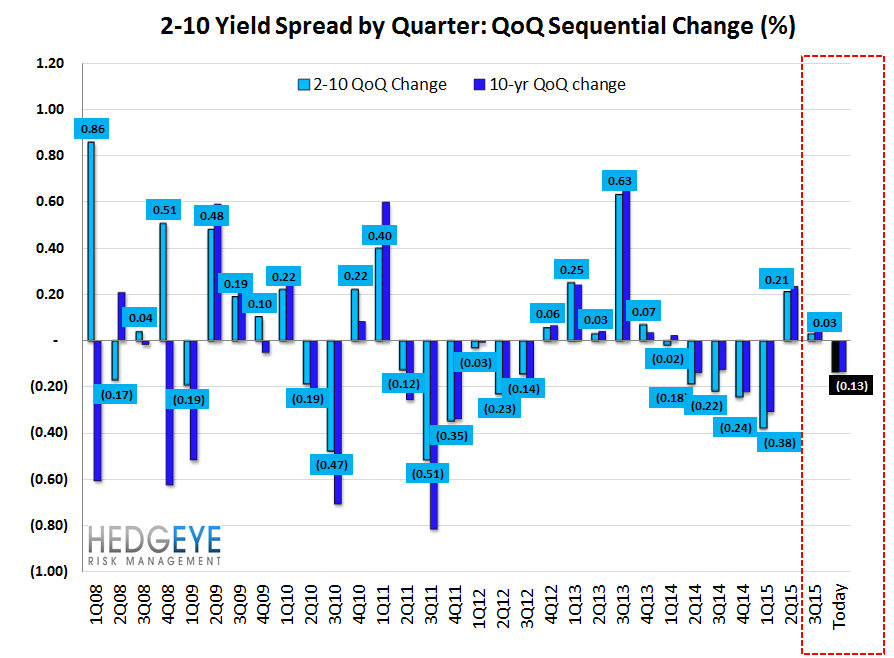
Yield Spreads
The 2-10 spread fell -5 basis points WoW to 148 bps. 3Q15TD, the 2-10 spread is averaging 161 bps, which is higher by 3 bps relative to 2Q15.

Joshua Steiner, CFA
Jonathan Casteleyn, CFA, CMT
