

Black Box Sales, Traffic
Black Box released same-restaurant sales and traffic estimates for the month of July last week that showed decelerating growth versus a strong performance in the month of June. Same-restaurant sales grew to +1.6% down 50 basis points (bps) sequentially, but up 110bps YoY and same-restaurant traffic decreased -1.2%, an 30bps sequential improvement, and up 50 bps YoY.
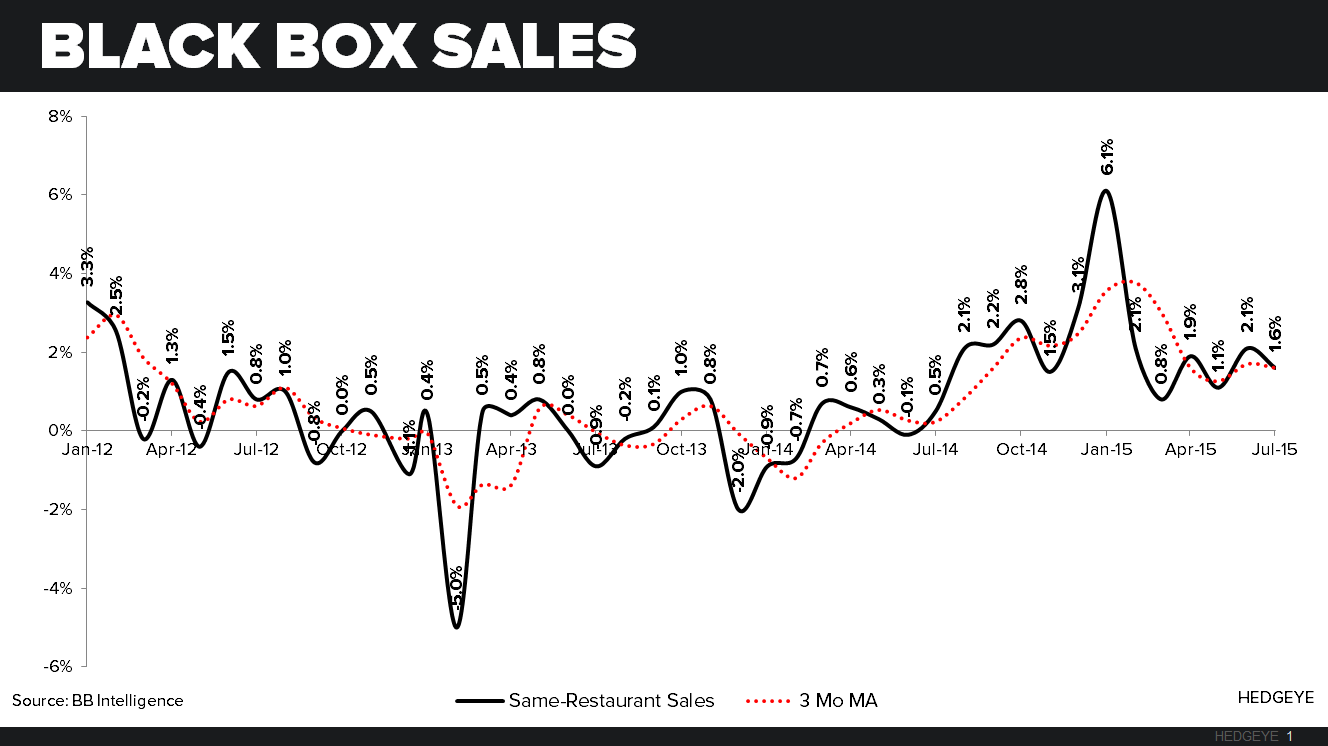

Restaurant price increases are beginning to taper off, after the nearly 12-months of increases. Not surprising after the last three months of flat price increases (~+3%), traffic has started to accelerate slightly. As you can see from the chart below, there is still a clear divergence between the operators taking price and a decline in traffic. In July there was a continuation of the uptick in traffic we saw in June, this trend bodes well for the industry, although we are still skeptical it will last long term.

Knapp July Sales Trends
Knapp reported that comparable restaurant sales in July 2015 were +0.5% for same-store sales and -1.1% for guest counts. July comparable restaurant sales represent a sequential slowdown of -100bps, while traffic is flat sequentially for the month. On a 2-year basis, sales decelerated to -0.3% and traffic matched June’s 2-year average, down -2.1%.
Employment Growth Slowing
The month of July was a mixed bag of results for employment. We saw the second month in a row of sequential employment declines for the 25-34 YOA cohort, and a -42bps YoY decline in the 20-24 YOA cohort. The 55-64 YOA cohort led the growth in the month, up 2.52% YoY, and 31bps sequentially. The downward trend is concerning, especially given that a large portion of the growth is in the 55-64 YOA cohort, with a considerable amount of that employment being part time.
July Employment Growth Data:
- 20-24 YOA +0.65% YoY; -41.9 bps sequentially
- 25-34 YOA +2.31% YoY; -24.9 bps sequentially
- 35-44 YOA +1.30% YoY; +25.9 bps sequentially
- 45-54 YOA -0.19% YoY; +16.2 bps sequentially
- 55-64 YOA +2.52% YoY; +31.0 bps sequentially

Thoughts from our macro team on July Employment
- Payrolls | Best Before the Crest: NFP and private payrolls slowed both sequentially and in rate of change terms. May/June get a net positive revision of +14K. While moving past peak rate-of-change in payroll growth does not herald an imminent roll in the eco cycle, the reality is that we’re late cycle in the current expansion and the labor party is always best before the crest.
- Unemployment Rate | Less Bad: The Unemployment Rate was flat sequentially at +5.3% but the internals were largely positive as the participation rate held steady and the labor force rose with the chg in employment > chg in unemployed. The U-6 rate (underemployment rate) dropped a tick to 10.4% with PT involuntary workers declining -180K.
- Wages | Up … But Not Really: Both Total Private & Nonsupervisory Worker wage growth accelerated sequentially but the gain just represents more oscillation above & below middling. Not what Team Janet wants to see although they’ve been making an attempt at quasi-marginalizing the trend in wage growth on policy decisions (see March Speech to review that commentary)
- Hours Worked | Prepare the Punditry: This will probably be the favorite pundit talking point – and with some justification. Average weekly hours worked rose by a tenth to 34.6hrs; the first increase in 5-months. Income = Hours worked * earnings per hour, so why a longer average work week is good for aggregate incomes is straightforward (& that lowly tenth adds up to something material when applied across an employment base of 142MM). Further, people working more hours is tantamount to more workers working the same hours – a concept termed “Job Equivalence” or “Labor Usage” - so you’ll hear the case made that the +215K NFP gain is equivalent to something like a ~350K gain when factoring in the increase in hours worked and taking a job equivalence perspective of the data.
- Income | Wages Weak, Income ↑: In a Keynesian economy, spending is king and the capacity for consumption flows from changes in the aggregate consumer P&L. One could take two, somewhat divergent, views of this morning’s wage & income data:
- Wage Growth: Private hourly Wage growth at 2.1% YoY was better sequentially but below estimates for +2.3% and does nothing to offset the disappointment from the slowdown reported in the ECI last week. Policy makers disappointment extends yet another month as wage inflation remains in RoC purgatory.
- Aggregate Income Growth: On net, the July data will be good for the aggregate income figures when they are reported for July. Again, the math is trivial: Flat Employment Gains + ↑Hours + ↑Wage growth = ↑ Aggregate DPI/Salary & Wage growth. In short, the aggregate consumer P&L improvement will remain ongoing with the savings rate remaining the swing factor for actual HH spending growth.
