

Key Takeaway:
The US high yield and leveraged loan markets continue to back up. High yield rose another 12 bps on the week (+38 bps M/M), hitting 7.06%). Rates are backing up on both credit and rate fears. Credit fears are flowing largely from the energy borrowers, who are now on the wrong end of 12+ months of crude and nat gas's price slide. Rate fears reflect the asymmetry of the Fed's current position.
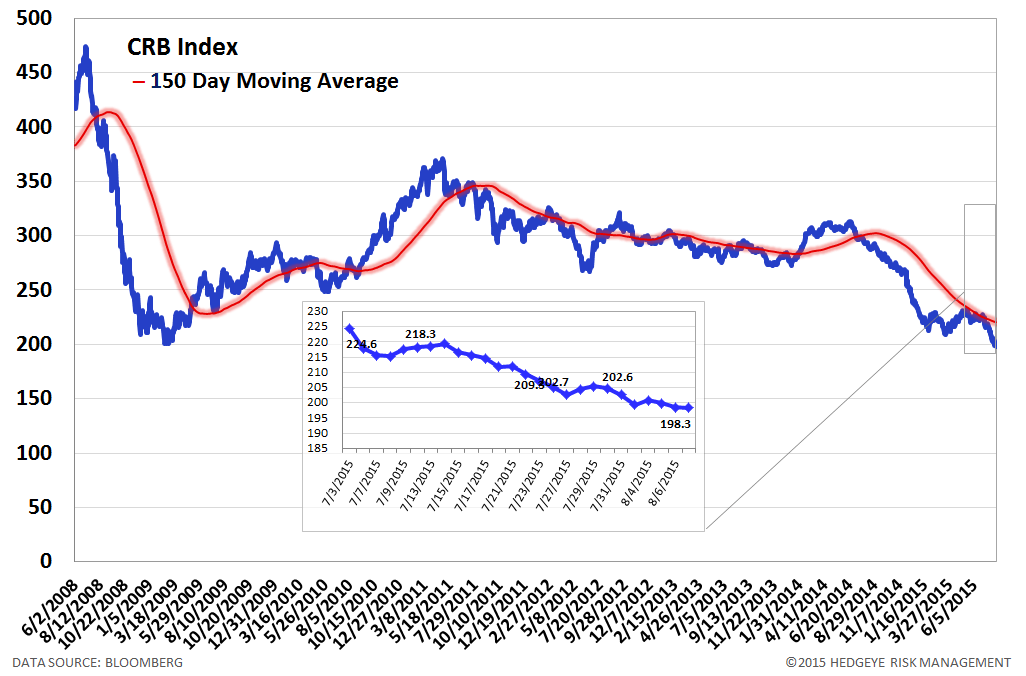
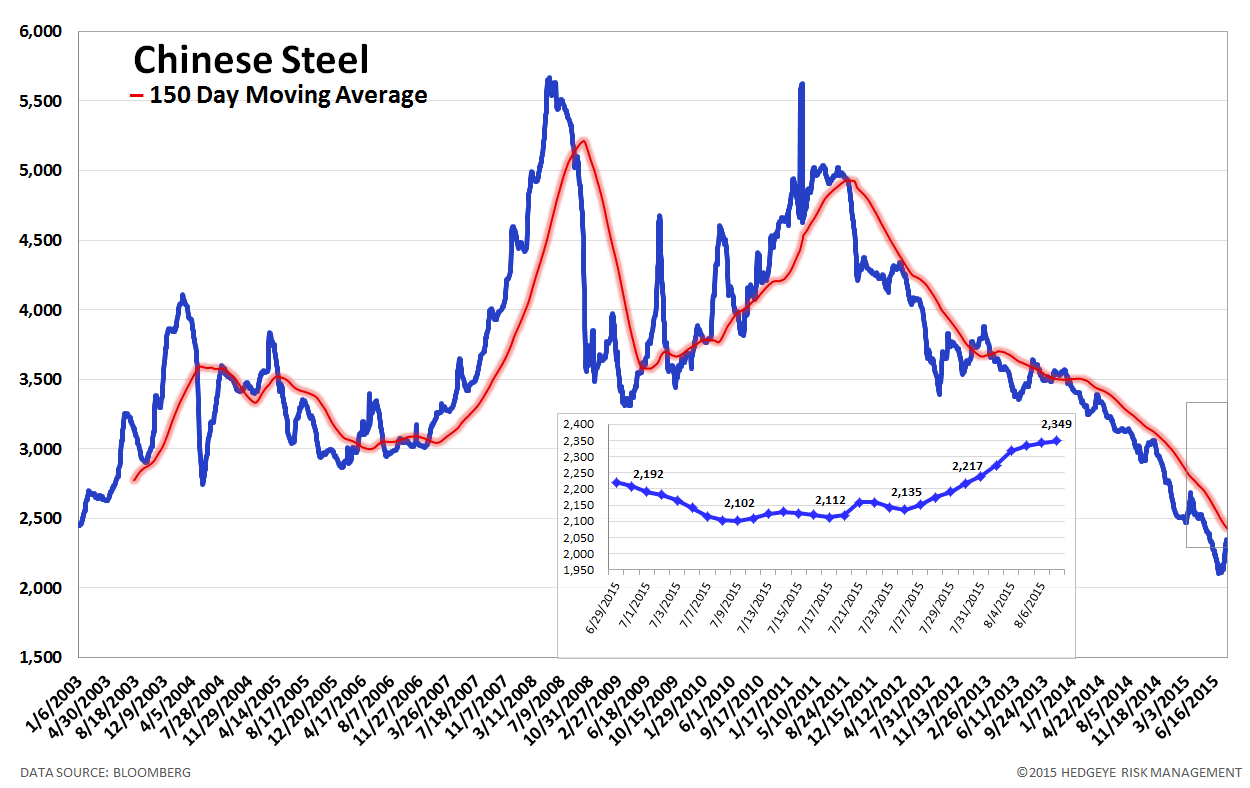
We've been watching China closely as a global catalyst and causal determinant of commodity prices. Interestingly, the two diverged this week. China got a little less bad on the margin (Chinese Steel prices +4.9% W/W & +11.3% M/M), while commodity prices generally (CRB) pushed to new lows (-3.5% W/W and -9.1% M/M).
Current Ideas:

Financial Risk Monitor Summary
• Short-term(WoW): Negative / 2 of 12 improved / 2 out of 12 worsened / 8 of 12 unchanged
• Intermediate-term(WoW): Positive / 6 of 12 improved / 4 out of 12 worsened / 2 of 12 unchanged
• Long-term(WoW): Positive / 3 of 12 improved / 1 out of 12 worsened / 8 of 12 unchanged

1. U.S. Financial CDS - Swaps widened for 17 out of 27 domestic financial institutions. Genworth Financial reported disappointing earnings, especially in its mortgage services and U.S. life divisions, last Tuesday. Following that, CDS on the company's debt widened by +152 bps to 459.
Tightened the most WoW: CB, ACE, AXP
Widened the most WoW: GNW, ALL, MET
Tightened the most WoW: ACE, CB, AXP
Widened the most MoM: GNW, MMC, MBI

2. European Financial CDS - As is often the case, Greek banks tend to sway the mean for the EU banking complex. The median is, therefore, the better measure. The median change in swaps was +2 bps on the week. Greece's equity market reopened last Monday and subsequently tumbled. Not surprisingly, the country's banks swaps followed suit, widening by +16 to +3,338 bps W/W.

3. Asian Financial CDS were mixed last week. Indian bank swaps rose +3 to +10 bps, while banks in Japan and China were little changed.

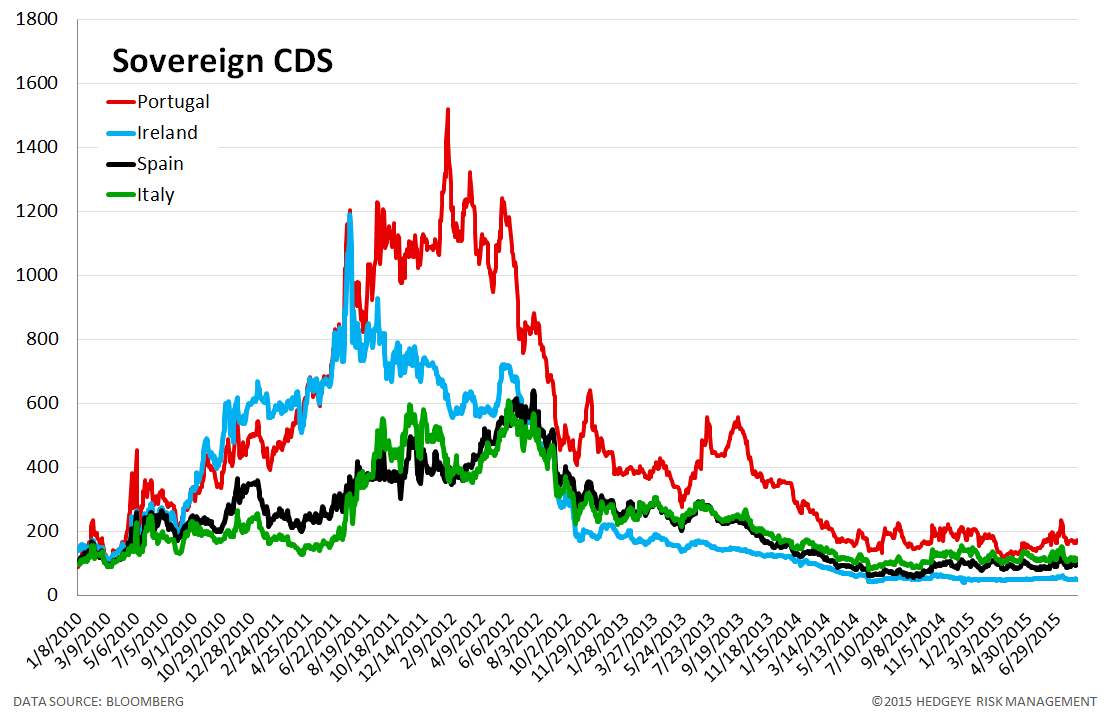
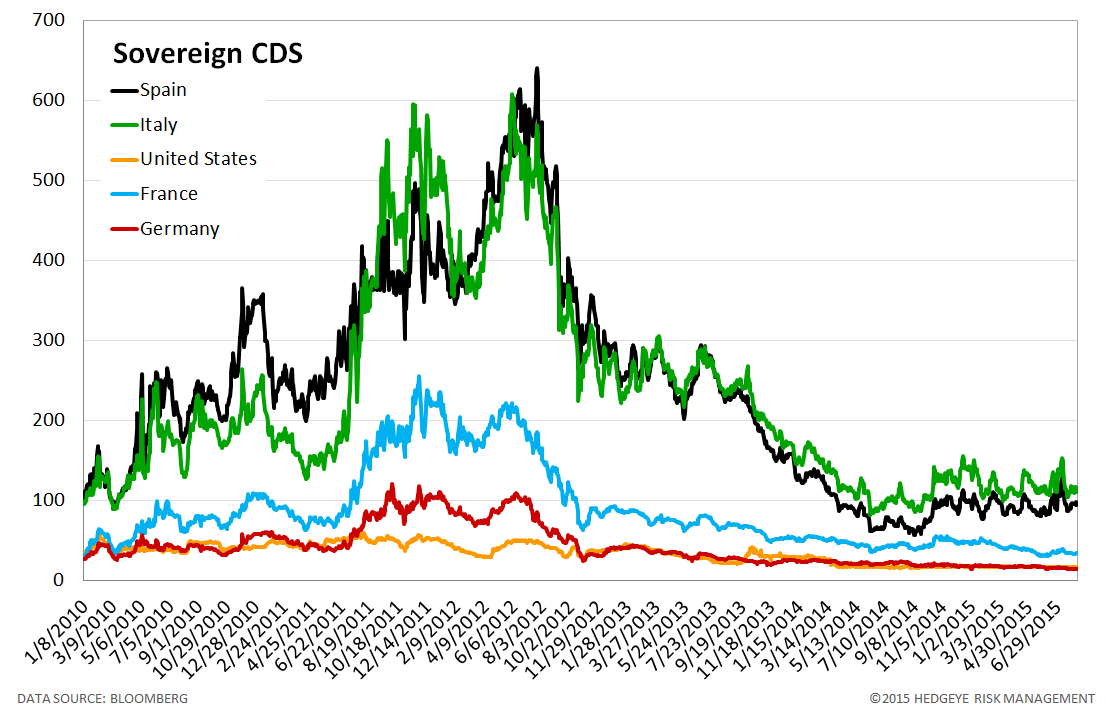
4. Sovereign CDS – DM sovereign swaps were little changed last week.

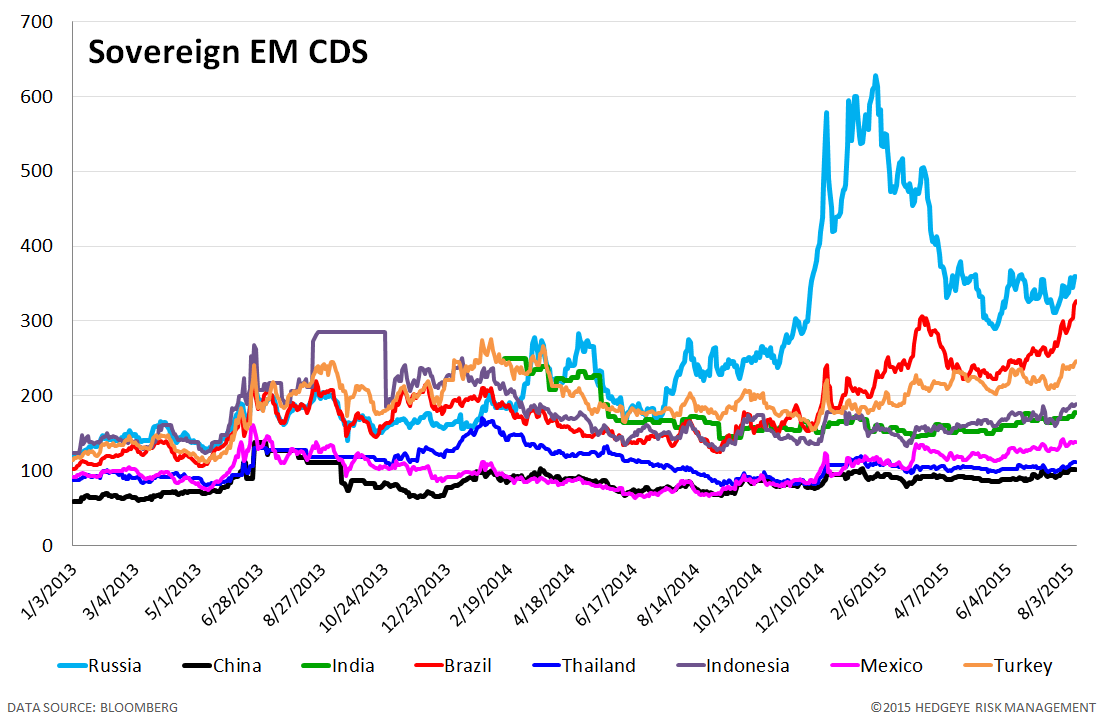
5. Emerging Market Sovereign CDS – Unlike DM, EM swaps widened notably last week with petro-states Brazil and Russia seeing the most widening, by +33 bps to 326 and +22 bps to 360 respectively.

6. High Yield (YTM) Monitor – High Yield rates rose 12 bps last week, ending the week at 7.06% versus 6.94% the prior week.

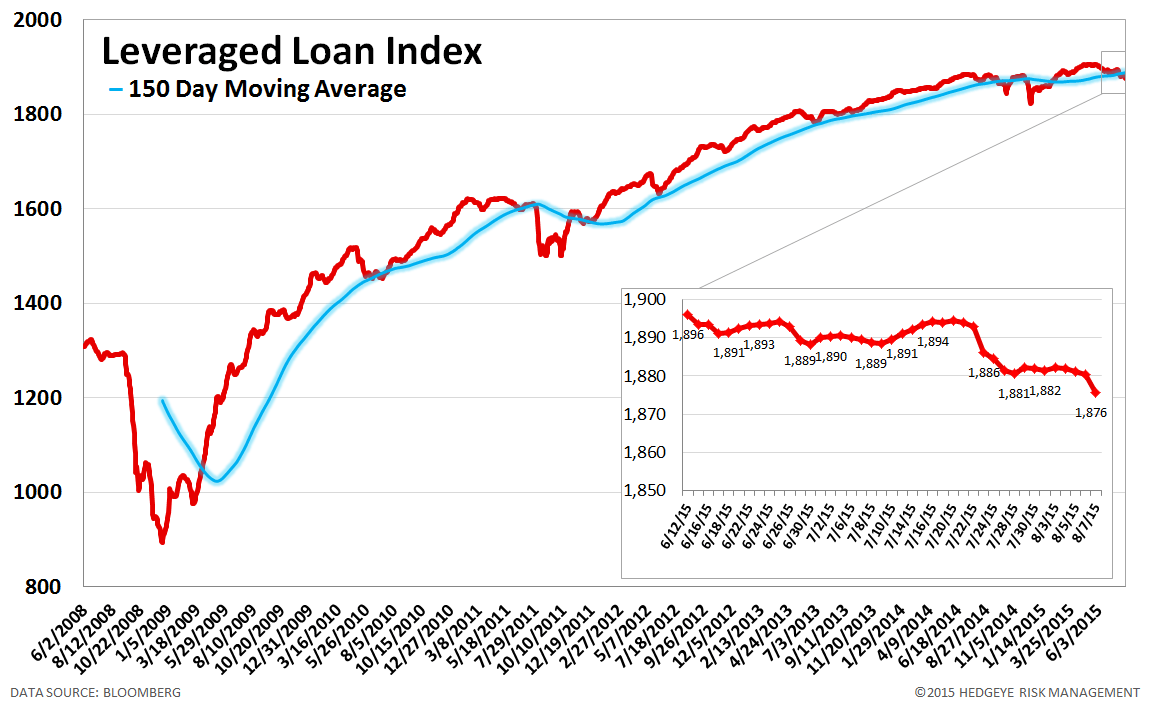
7. Leveraged Loan Index Monitor – The Leveraged Loan Index fell 6.0 points last week, ending at 1876.
8. TED Spread Monitor – The TED spread was unchanged last week at 25 bps.

9. CRB Commodity Price Index – The CRB index fell -3.5%, ending the week at 198 versus 205 the prior week. As compared with the prior month, commodity prices have decreased -9.1%. We generally regard changes in commodity prices on the margin as having meaningful consumption implications.
10. Euribor-OIS Spread – The Euribor-OIS spread (the difference between the euro interbank lending rate and overnight indexed swaps) measures bank counterparty risk in the Eurozone. The OIS is analogous to the effective Fed Funds rate in the United States. Banks lending at the OIS do not swap principal, so counterparty risk in the OIS is minimal. By contrast, the Euribor rate is the rate offered for unsecured interbank lending. Thus, the spread between the two isolates counterparty risk. The Euribor-OIS spread was unchanged at 10 bps.

11. Chinese Interbank Rate (Shifon Index) – The Shifon Index rose 6 basis points last week, ending the week at 1.53% versus last week’s print of 1.47%. The Shifon Index measures banks’ overnight lending rates to one another, a gauge of systemic stress in the Chinese banking system.

12. Chinese Steel – Steel prices in China rose 4.9% last week, or 110 yuan/ton, to
2349 yuan/ton. We use Chinese steel rebar prices to gauge Chinese construction activity and, by extension, the health of the Chinese economy.
13. 2-10 Spread – Last week the 2-10 spread tightened to 144 bps, -7 bps tighter than a week ago. We track the 2-10 spread as an indicator of bank margin pressure.

14. XLF Macro Quantitative Setup – Our Macro team’s quantitative setup in the XLF shows 0.7% upside to TRADE resistance and 0.8% downside to TRADE support.

Joshua Steiner, CFA
Jonathan Casteleyn, CFA, CMT
