“Hoo-hoo! Big summer blowout!”
-Oaken
Forget the blowout in #Deflation-linked currencies, commodities, stocks, bonds, etc. this morning and focus your mind on the old-new bull case that didn’t work. “Gas prices are low” is back. Everyone who loved US growth with high gas prices loves a big summer blowout!
Disney (DIS) reported blowout earnings last night (sort of), but everyone and their brother’s sister owns the Low-Beta-Big-Cap-Chart (Style Factors that are working) at this stage of the game, so the stock is indicated down -6% on that. Stocks do correct.
I have (going on) 3 daughters (1 son), so I’m a big Frozen fan (sort of). Sadly, my son and I both know every word to some of your favorite Frozen songs. To commemorate our wedding anniversary today, I used my wife Laura’s favorite movie scene as my opening quote.

Back to the Global Macro Grind…
Big summer blowout in Oil, Russian Rubles, Linn Energy (LINE) – and Apple! And while I wasn’t brave enough to signal buy on “valuation” in any of the #Deflation-links, yesterday I did dip a toe in the water in AAPL as it was signaling immediate-term TRADE oversold.
Hoo-hoo!
Don’t worry, I’m going to keep the most over-owned stock in human history (that’s what I called it when it broke the @Hedgeye TREND risk line of $126) on as short a leash as my man Oaken did his cabin inventory. Being long AAPL from here isn’t going to be easy.
Since the bull case for AAPL is efficiently “covered” by the Old Wall, let’s apply some Style Factoring to the analysis this morning:
- LOW-BETA – yes, relatively speaking to DIS at 1.1, it has a 0.9 Beta
- SIZE – does the mother of all market caps have “Big Cap”? obviously, yes
- SECTOR – oops, Tech (XLK) is bearish TRADE and TREND @Hedgeye (mainly because AAPL is)
AAPL is the heaviest weight in the XLK (Tech Sector ETF promoted on the inside cover page of Barron’s this weekend) and it’s bearish TRADE and TREND right now whereas MSFT and GOOGL are bullish on both of those risk management durations.
In other words, that’s why I said being long AAPL for anything more than a Real-Time Alert TRADE signal isn’t going to be easy. It’s always easier for me to be long companies like GOOGL (Low-Beta at 1.0, Big Cap, #NiceChart!) whose recent earnings release was a good thing.
When a company’s most recent report was a bad thing, then “longer-term” investors are hostage to all of the other bad macro things that could affect the price/volume/volatility of the stock (until they report their next quarter).
Moving along to that darn China thing (yep, it’s a Style Factor in your portfolio too), the Chinese dudes who have been trying to ban everyone from selling saw more selling overnight. This puts the Shanghai Composite in the following multi-duration @Hedgeye frame:
- CONTEXT: down -1.7% overnight (post a +3.7% up day prior, but a down -10.1% week prior to that)
- TRADE = bearish, with no immediate-term support to 3441 (closed at 3694)
- TREND = bearish, with intermediate-term resistance up at 4271
This is another major reason why owning AAPL is less easy than it was when the chart “looked good.” China is a very “bad macro thing” affecting the emotional break-downs of moving monkeys chasing AAPL’s “200-day.”
How bad is that thing btw? China, I mean. Since these dudes make up the numbers, can you have any confidence that you know the answer to that risk management question? Why can’t China be to 2015 what Lehman was to world markets in 2008?
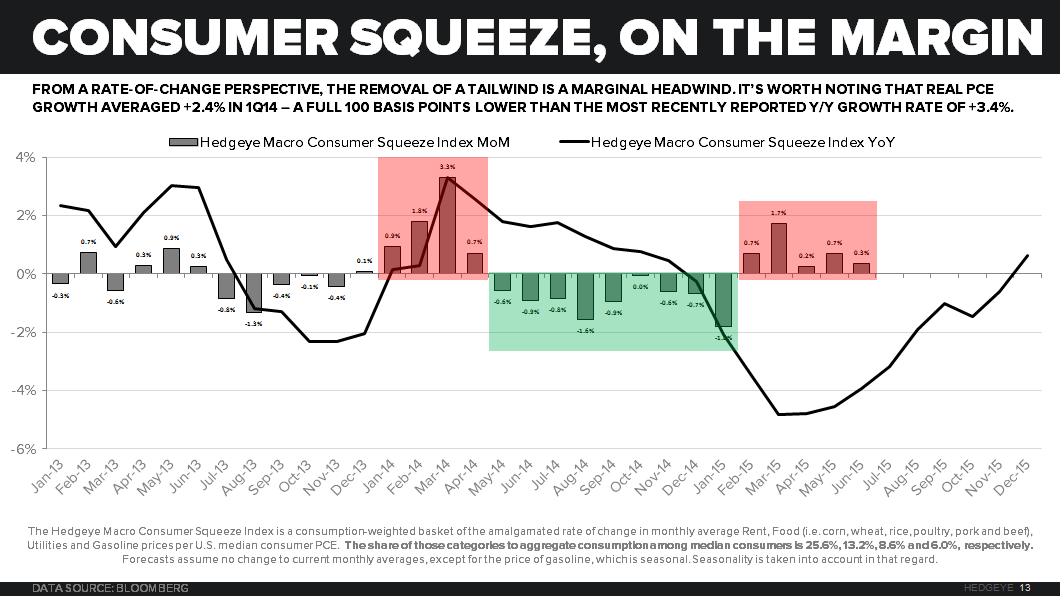
Back to the big summer blowout in “gas prices” thing. As you can see in today’s Chart of The Day, back by popular client demand is the refreshed Hedgeye Squeeze Index, which reminds you that gas prices are only 6% of the median US consumer’s expenditures.
If you want US consumers (the median, who only makes < $50,000/year – no that’s probably not you) to accelerate real (inflation adjusted) spending, what you really need is a big generational blowout in their #1 cost-of-living (hint: shelter = 26%).
Oaken, bro – give me a price check on that. CoreLogic’s report on US Home Prices was +1.7% month-over-month (reported yesterday), taking year-over-year US #HousingInflation to +6.5%. That’s the 4th straight month of acceleration, in rate of change terms.
Sure, my boys reiterated our bullish 2015 housing call on that data point. But you can’t climb this mountain and come out of the US cost-of-living cabin feeling like everything was on sale. Boo-hoo!
Our immediate-term Global Macro Risk Ranges are now:
UST 10yr Yield 2.14-2.29%
SPX 2068-2119
RUT 1
VIX 11.86-15.24
USD 96.99-98.34
EUR/USD 1.08-1.10
Oil (WTI) 45.01-47.54
Best of luck out there today,
KM