Like Roubini and Houdini, the bearish side of this market’s daily trading volume has vanished. The short sellers of everything Great Depressionista may be out of supply on the buy-to-cover side of the US market. It has been a long 9 months of short covering. October 2009 may very well have signaled the crescendo.
In the Chart of The Week that Matt Hedrick and I put together you’ll take away two very important points:
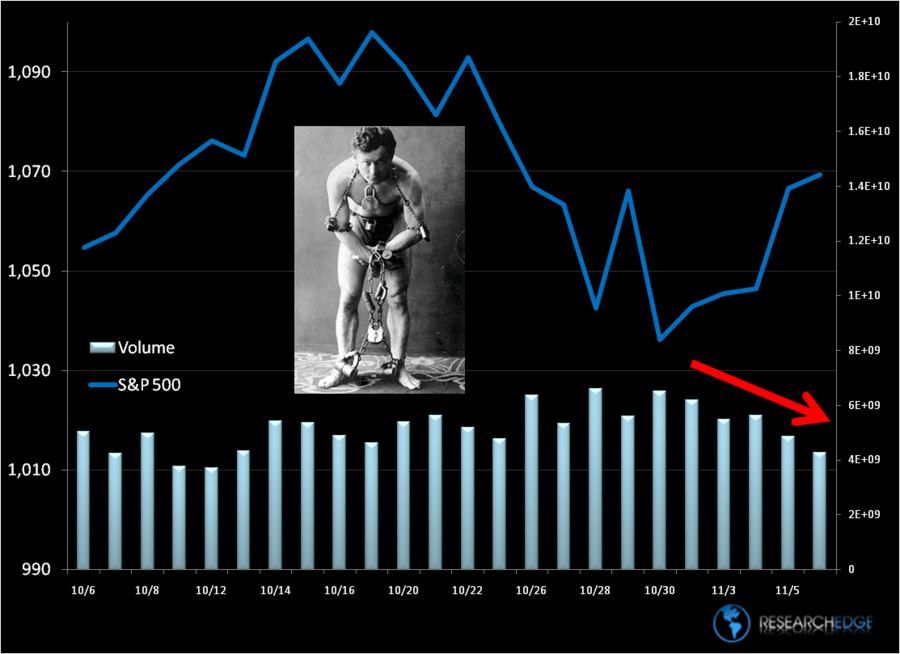
- The SP500 selloff from its YTD high (1097) came on accelerating daily/weekly volume studies
- The SP500 rally from its most recent higher-low (1036) came on decelerating daily/weekly volume studies
While volume is only one factor in our multi-factor risk management model, it’s a critical one, particularly when combined with price momentum.
Provided that volumes remain light on the up moves, and the SP500 fails to make a higher-YTD-high versus that established on October 19th, 2009, the probabilities continue to heighten that the YTD highs for 2009 are in.
Fully realizing that the SP500 is trading up a +1.3% at 1083 today, my risk management process still leads me to make this call.
“You’ll miss 100% of the shots you don’t take”
-Wayne Gretzky
Keith R. McCullough
Chief Executive Officer