Key Takeaway:
Risk grew on a number of fronts last week. Our heatmap is flashing mostly red in the short-term driven by widening CDS across sovereigns and financials globally. Beyond this, the high yield market is showing signs of heavy strain with yields rising 30 bps on the week and now tracking higher by +60 bps (to 6.99%) vs month-ago levels.
The basic challenge with high yield at this point in the cycle is that it just can't win. This may seem counterintuitive since there aren't many other ways to capture yield. The basic problem is that both rates and credit are now poised to work against you.
Meanwhile, the Chinese stock market was under significant pressure earlier today. The Shanghai Composite Index fell -8.5% and the Shenzhen Composite declined -7% for the day.
Current Ideas:

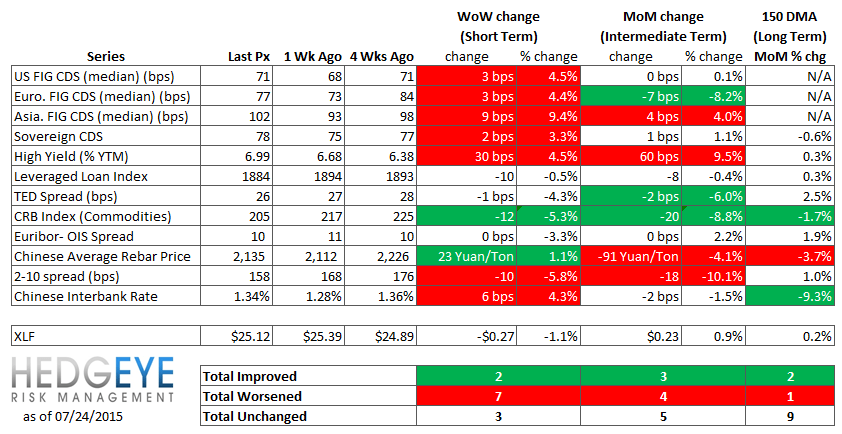
Financial Risk Monitor Summary
• Short-term(WoW): Negative / 2 of 12 improved / 7 out of 12 worsened / 3 of 12 unchanged
• Intermediate-term(WoW): Negative / 3 of 12 improved / 4 out of 12 worsened / 5 of 12 unchanged
• Long-term(WoW): Positive / 2 of 12 improved / 1 out of 12 worsened / 9 of 12 unchanged
1. U.S. Financial CDS - Swaps widened for 17 out of 27 domestic financial institutions, coinciding with the S&P 500's -2.2% slide for the week after hitting a top of 2,132 on Monday. SLM Corporation CDS widened the most, by 93 bps to 436, following the company's earnings announcement on July 23.
Tightened the most WoW: CB, ACE, GNW
Widened the most WoW: SLM, JPM, MET
Tightened the most WoW: CB, GNW, AIG
Widened the most MoM: SLM, MMC, MBI

2. European Financial CDS - While Greek bank CDS tightened sharply, swaps were mostly wider across the EU banking system.

3. Asian Financial CDS - The cost to protect against bank default continues to rise in China and India.

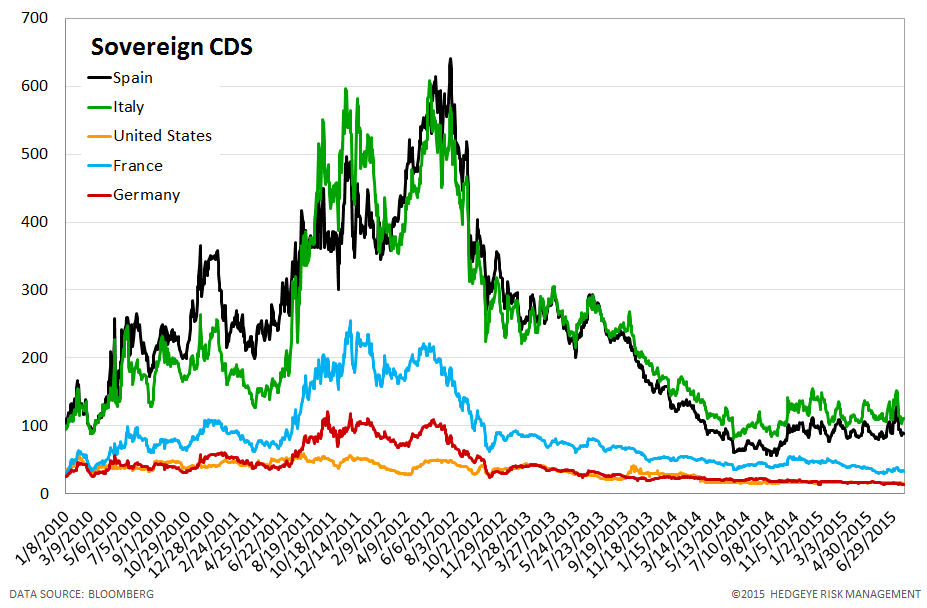
4. Sovereign CDS – Sovereign swaps were mixed last week. CDS tightened for the U.S., Germany, France, Ireland, and Japan. Meanwhile, CDS for Italy, Spain, and Portugal widened.


5. Emerging Market Sovereign CDS – Emerging market swaps widened last week. Brazilian sovereign swaps widened the most, by 29 bps to 294 bps, followed by Russian swaps, which widened by 23 bps to 334.


6. High Yield (YTM) Monitor – High Yield rates rose 30 bps last week, ending the week at 6.99% versus 6.68% the prior week.

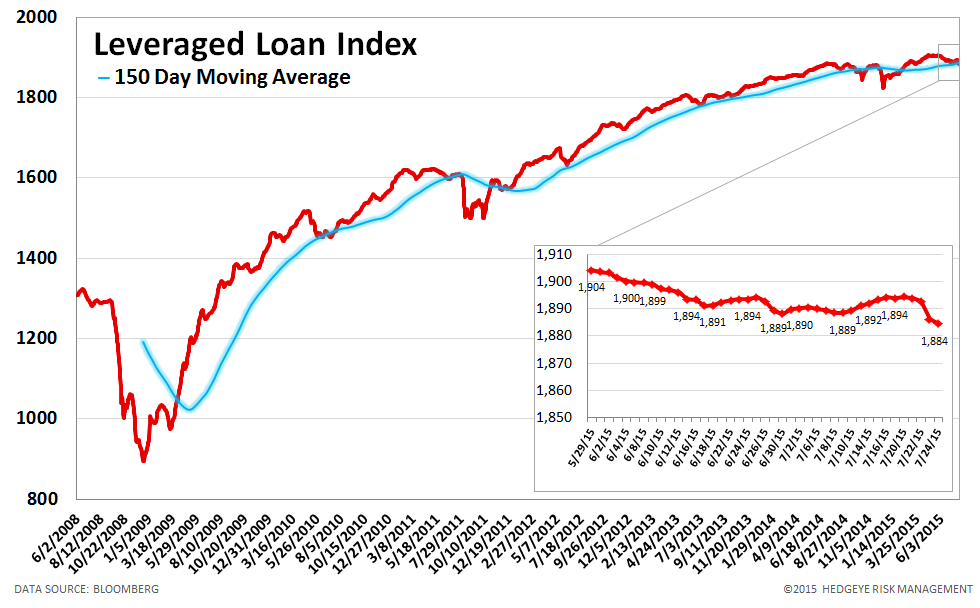
7. Leveraged Loan Index Monitor – The Leveraged Loan Index fell 10.0 points last week, ending at 1884.
8. TED Spread Monitor – The TED spread fell 1 basis points last week, ending the week at 26 bps this week versus last week’s print of 27 bps.

9. CRB Commodity Price Index – The CRB index fell -5.3%, ending the week at 205 versus 217 the prior week. As compared with the prior month, commodity prices have decreased -8.8%. We generally regard changes in commodity prices on the margin as having meaningful consumption implications.

10. Euribor-OIS Spread – The Euribor-OIS spread (the difference between the euro interbank lending rate and overnight indexed swaps) measures bank counterparty risk in the Eurozone. The OIS is analogous to the effective Fed Funds rate in the United States. Banks lending at the OIS do not swap principal, so counterparty risk in the OIS is minimal. By contrast, the Euribor rate is the rate offered for unsecured interbank lending. Thus, the spread between the two isolates counterparty risk. The Euribor-OIS spread was unchanged at 10 bps.

11. Chinese Interbank Rate (Shifon Index) – The Shifon Index rose 5 basis points last week, ending the week at 1.34% versus last week’s print of 1.28%. The Shifon Index measures banks’ overnight lending rates to one another, a gauge of systemic stress in the Chinese banking system.

12. Chinese Steel – Steel prices in China rose 1.1% last week, or 23 yuan/ton, to 2135 yuan/ton. We use Chinese steel rebar prices to gauge Chinese construction activity and, by extension, the health of the Chinese economy.

13. 2-10 Spread – Last week the 2-10 spread tightened to 158 bps, -10 bps tighter than a week ago. We track the 2-10 spread as an indicator of bank margin pressure.

14. XLF Macro Quantitative Setup – Our Macro team’s quantitative setup in the XLF shows 0.8% upside to TRADE resistance and -1.5% downside to TREND support.

Joshua Steiner, CFA
Jonathan Casteleyn, CFA, CMT