

Our Hedgeye Housing Compendium table (below) aspires to present the state of the housing market in a visually-friendly format that takes about 30 seconds to consume.

Today's Focus: June New Home Sales
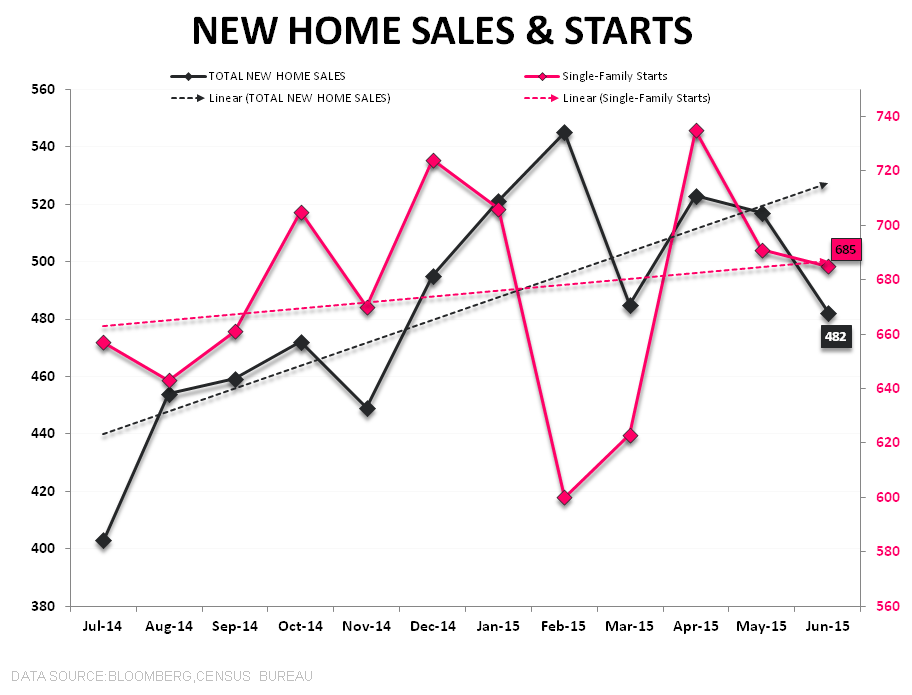
It’s generally difficult to characterize +18% YoY growth as disappointing but with sales retreating -6.6% sequentially (vs +0.3% estimates) along with negative revisions to both April and May, New Home Sales in June could be aptly characterized as a dud.
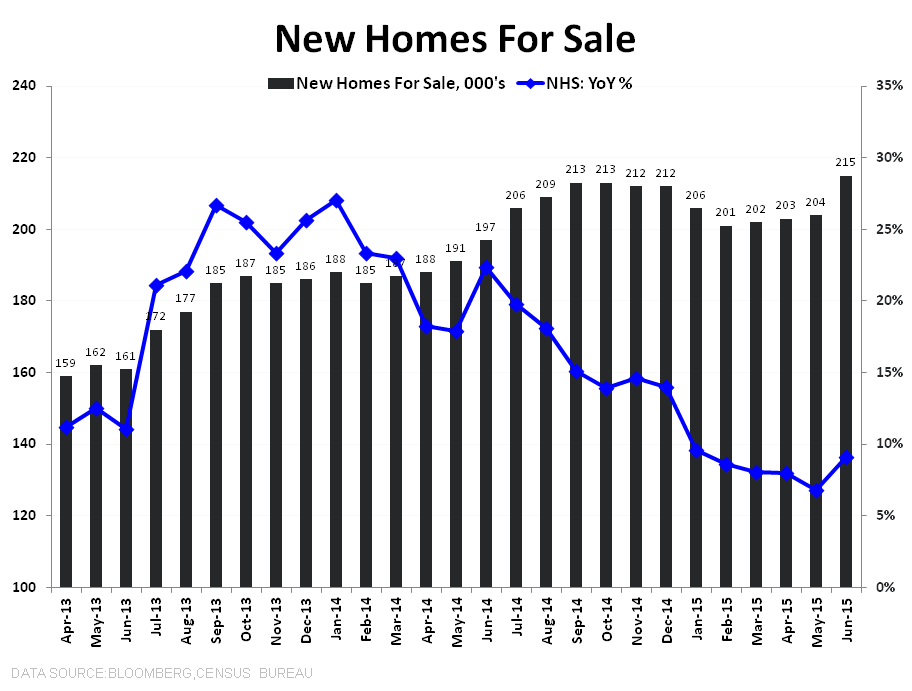
On the supply side, the inventory of new homes rose +5.4% month-over-month to 215K on a unit basis while accelerating +230 bps sequentially to +9.1% YoY. Geographically, sales declined sequentially across all regions except the Northeast while year-over-year sales growth was positive across all geographies with growth of +23% and +24% in the Northeast and South, respectively, leading the gains. As a percentage of the total market, New Home share dropped to just 8.1% in June (LT average = ~11.4%) as existing sales made another post-crisis high in the latest month.
As it relates to New Construction activity, we highlighted the distortion in the May/June Starts data last week but it’s worth a quick re-iteration. The +295% YoY growth in MF permits in the Northeast ahead of the impending NYC tax exemption expiry helped augment the Total Starts figures for a second month in June and drove MF share of total up to a 42-year high. A reversal of that pull forward sets the stage for a potential retreat/disappointment in the reported July data.
IS GOOD, GOOD ENOUGH? | CONCEPTUAL REDUX: We titled our 3Q15 Housing Themes Presentation IS GOOD, GOOD ENOUGH?. The deck is over 120 slides of data intensive analysis but the overarching theme can be sufficiently captured conceptually: The Housing data in 3Q will be “good” but the large-scale positive reversal we’ve seen over the last ~9-months is now rearview, the comps get tougher after the reported June data and we don’t have any discrete catalysts in the nearer-term. Further, performance seasonality in the stocks is recurrent and pervasive and 3Q represents the soft-patch period.
From a longer-term perspective, the mean reversion upside to average & peak levels of activity (recall: housing cycles are long and autocorrelated) remains both conspicuous and compelling, but the asymmetry in the setup and the leverage to our expectation for a positive inflection in both fundamentals and investor attitudes when we reversed to bullish back in November of last-year has, in large part, played out.
Again, we think the data will remain “good” - with Purchase Application demand flat sequentially in 3Q (but holding near 2Y highs) and NHS declining in the latest month (but still above the TTM ave) “good” is proving an apt adjective - but, tactically, the prospect for aggregate builder outperformance in the near-term carries a diminished probability. Here, the Title Insurers and Mortgage Insurers offer some tactical cover while moving upstream towards larger cap/lower beta/liquidity/quality style factors make sense in terms of direct builder exposure.


About New Home Sales:
Each month the Census Department releases the New Home Sales report, which measures the number of newly constructed homes that have been sold in the month. The difference between the New Home Sales report and the Starts and Permits report is that New Home Sales only includes single family spec homes built and sold by builders, and does not include condos, apartments, or owner-built units. This is why New Home Sales typically run at roughly half the rate of Starts.
Joshua Steiner, CFA
Christian B. Drake
