

Investment Company Institute Mutual Fund Data and ETF Money Flow:
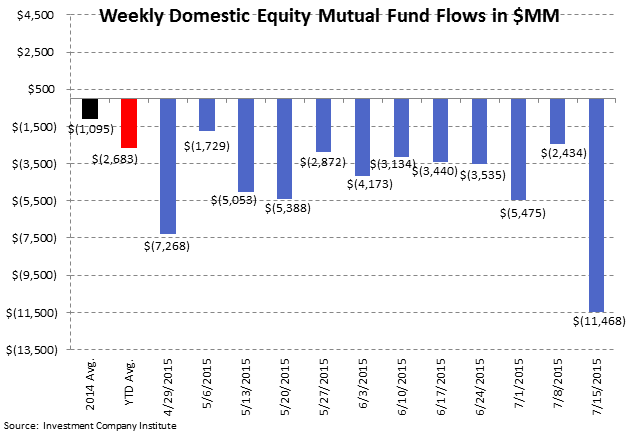
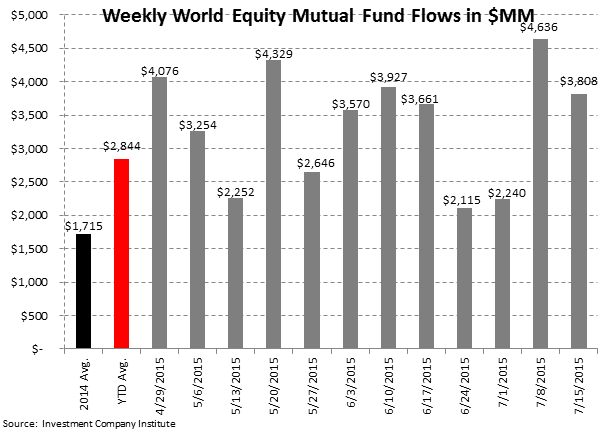
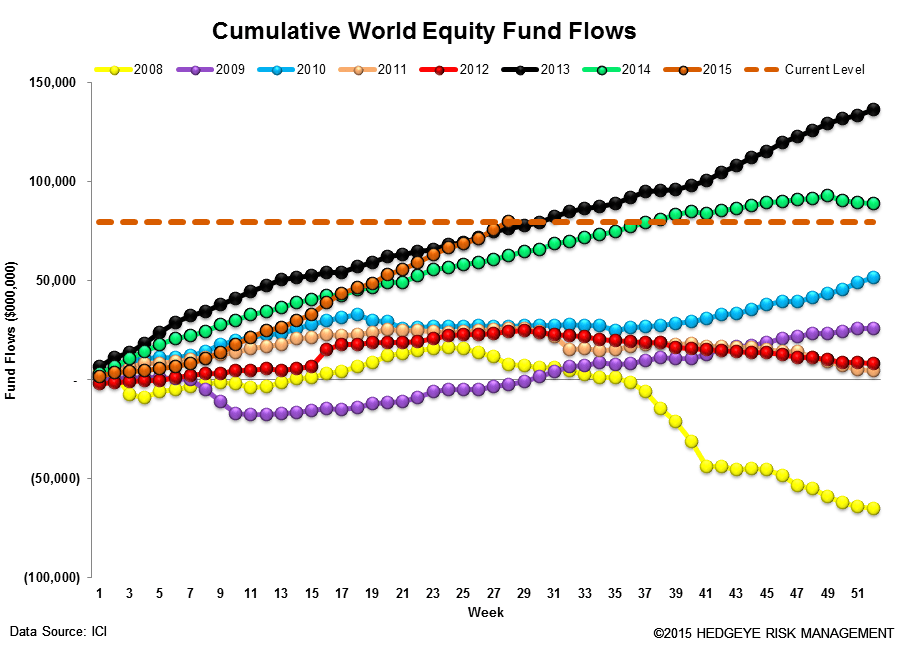
The standout in the most recent ICI mutual fund survey was that investors withdrew -$11.5 billion from domestic equity funds in the five day period ending July 15th. This amounts to the largest weekly withdrawal from the asset class since August 2011 and now amounts to the worst start year-to-date in the public ICI data for U.S. stock funds. Cumulative outflows in 2015 have now reached -$75.1 billion in the first 28 weeks of the year, over -$12 billion worse than the 28 week start in 2012 where -$63 billion left the active domestic equity mutual fund category (and over -$20 billion worse than the draconian 2008 period). Conversely, investors continue to pour money into World or International stock funds with cumulative 2015 inflows tallying +$79.6 billion. That is good enough for a +$3 billion better start than the prior best 28 week period in 2013, where the first 6.5 months generated +$76.2 billion in investor inflow.

In the most recent 5-day period ending July 15th, total equity mutual funds put up net outflows of -$7.7 billion, trailing the year-to-date weekly average inflow of +$161 million and the 2014 average inflow of +$620 million. The outflow was composed of international stock fund contributions of +$3.8 billion and domestic stock fund withdrawals of -$11.5 billion. International equity funds have had positive flows in 48 of the last 52 weeks while domestic equity funds have had only 10 weeks of positive flows over the same time period.
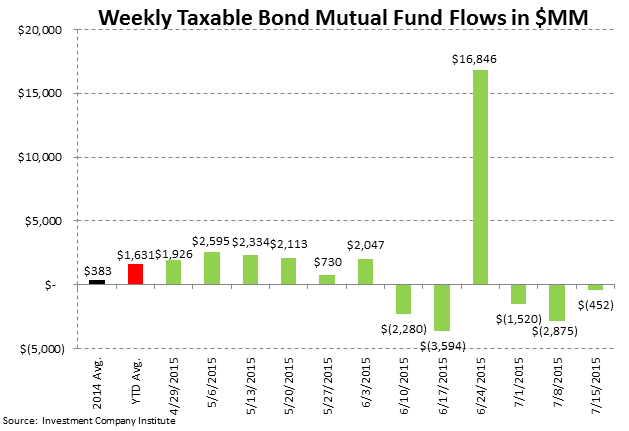
Fixed income mutual funds put up net outflows of -$487 million, trailing the year-to-date weekly average inflow of +$1.9 billion and the 2014 average inflow of +$929 million. The outflow was composed of tax-free or municipal bond funds withdrawals of -$35 million and taxable bond funds withdrawals of -$452 million.
Equity ETFs had net subscriptions of +$7.8 billion, outpacing the year-to-date weekly average inflow of +$2.5 billion and the 2014 average inflow of +$3.2 billion. Fixed income ETFs had net inflows of +$2.6 billion, outpacing the year-to-date weekly average inflow of +$907 million and the 2014 average inflow of +$1.0 billion.

Mutual fund flow data is collected weekly from the Investment Company Institute (ICI) and represents a survey of 95% of the investment management industry's mutual fund assets. Mutual fund data largely reflects the actions of retail investors. Exchange traded fund (ETF) information is extracted from Bloomberg and is matched to the same weekly reporting schedule as the ICI mutual fund data. According to industry leader Blackrock (BLK), U.S. ETF participation is 60% institutional investors and 40% retail investors.
Most Recent 12 Week Flow in Millions by Mutual Fund Product: Chart data is the most recent 12 weeks from the ICI mutual fund survey and includes the weekly average for 2014 and the weekly year-to-date average for 2015:


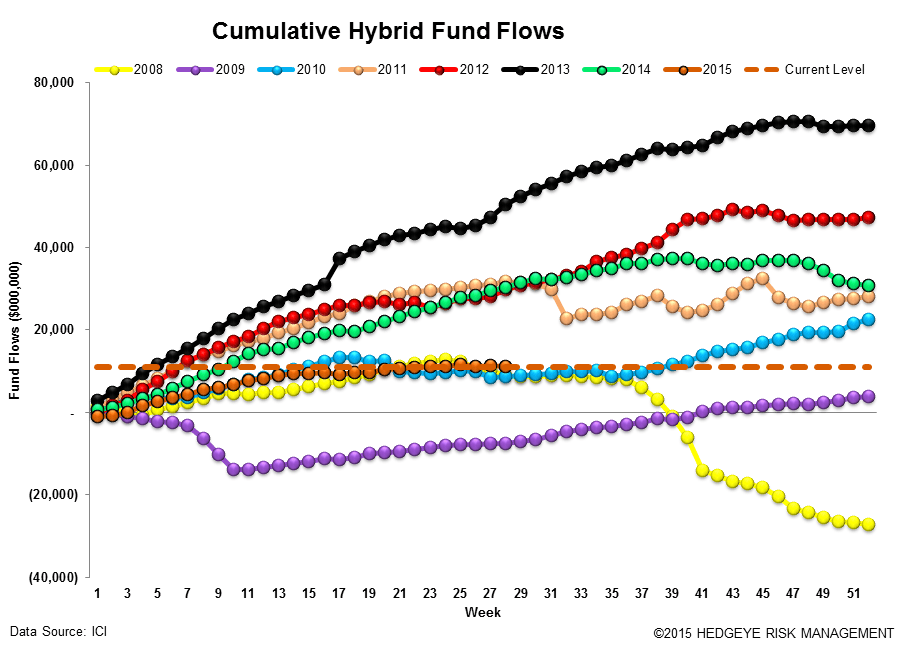
Cumulative Annual Flow in Millions by Mutual Fund Product: Chart data is the cumulative fund flow from the ICI mutual fund survey for each year starting with 2008.


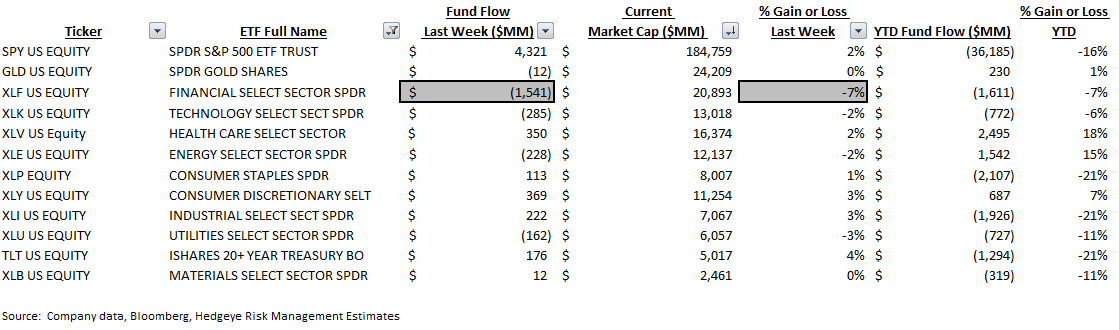
Most Recent 12 Week Flow within Equity and Fixed Income Exchange Traded Funds: Chart data is the most recent 12 weeks from Bloomberg's ETF database (matched to the Wednesday to Wednesday reporting format of the ICI), the weekly average for 2014, and the weekly year-to-date average for 2015. In the third table are the results of the weekly flows into and out of the major market and sector SPDRs:


Sector and Asset Class Weekly ETF and Year-to-Date Results: In sector SPDR callouts, the Financials XLF ETF lost -$1.5 billion or -7% to redemptions. The large outflow was likely due in part to dovish comments by Fed Chair Janet Yellen on July 15th. In addition, the iShares 20 year Treasury ETF had a better week with the TLT gathering $176 million in new assets, good for a +4% increase in AUM.
Cumulative Annual Flow in Millions within Equity and Fixed Income Exchange Traded Funds: Chart data is the cumulative fund flow from Bloomberg's ETF database for each year starting with 2013.


Net Results:
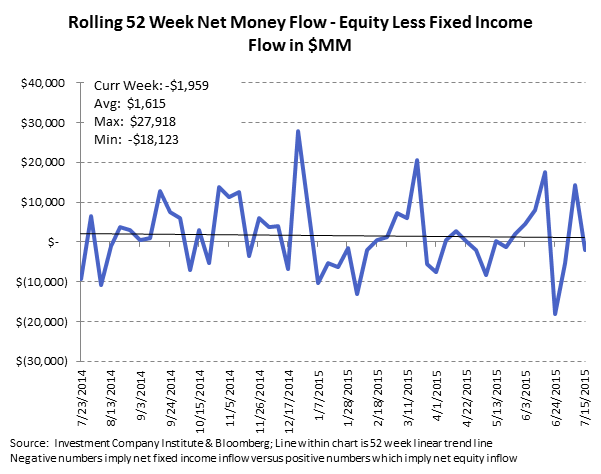
The net of total equity mutual fund and ETF flows against total bond mutual fund and ETF flows totaled a negative -$2.0 billion spread for the week (+$173 million of total equity inflow net of the +$2.1 billion inflow to fixed income; positive numbers imply greater money flow to stocks; negative numbers imply greater money flow to bonds). The 52-week moving average is +$1.6 billion (more positive money flow to equities) with a 52-week high of +$27.9 billion (more positive money flow to equities) and a 52-week low of -$18.1 billion (negative numbers imply more positive money flow to bonds for the week.)
Exposures: The weekly data herein is important for the public asset managers with trends in mutual funds and ETFs impacting the companies with the following estimated revenue impact:

Jonathan Casteleyn, CFA, CMT
Joshua Steiner, CFA
