

Our Hedgeye Housing Compendium table (below) aspires to present the state of the housing market in a visually-friendly format that takes about 30 seconds to consume.

Today's Focus: June Existing Home Sales, FHFA HPI & MBA Purchase Apps
1. EHS follows PHS to new highs. 2. EHS Inventory & FHFA corroborate HPI acceleration. 3. Purchase Apps signal stable demand trends to start 3Q.
Today’s triple header of housing data tells a congruous story of continued improvement in demand trends with price and inventory data supportive of accelerating price growth.
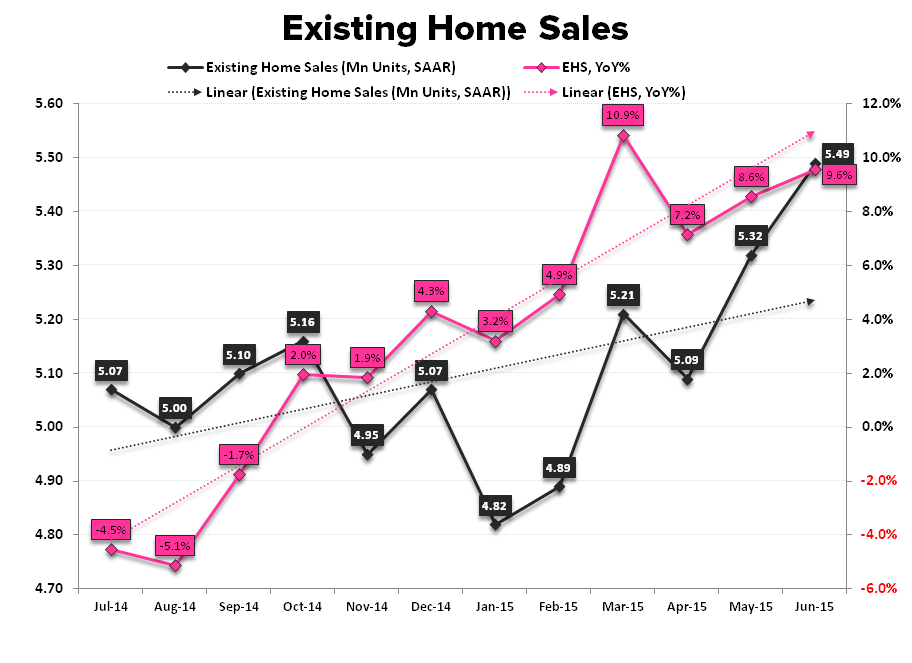
Existing Home Sales, which headlined this morning’s data, rose +3.2% sequentially and accelerated to +9.6% YoY as transaction activity in the existing market made a new post-crisis high.
Taking a composite view of today’s releases, there are a few key takeaways:
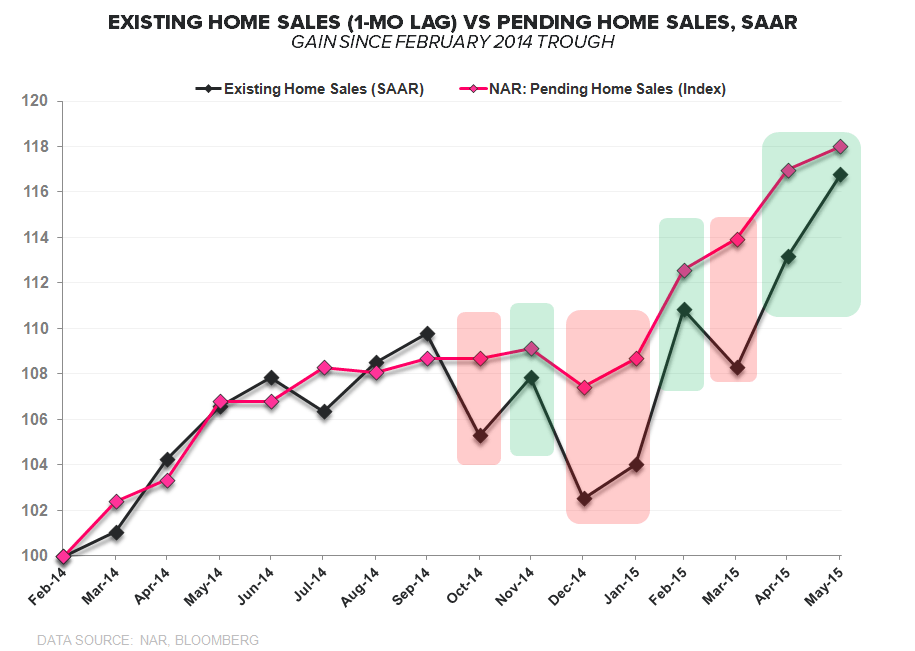
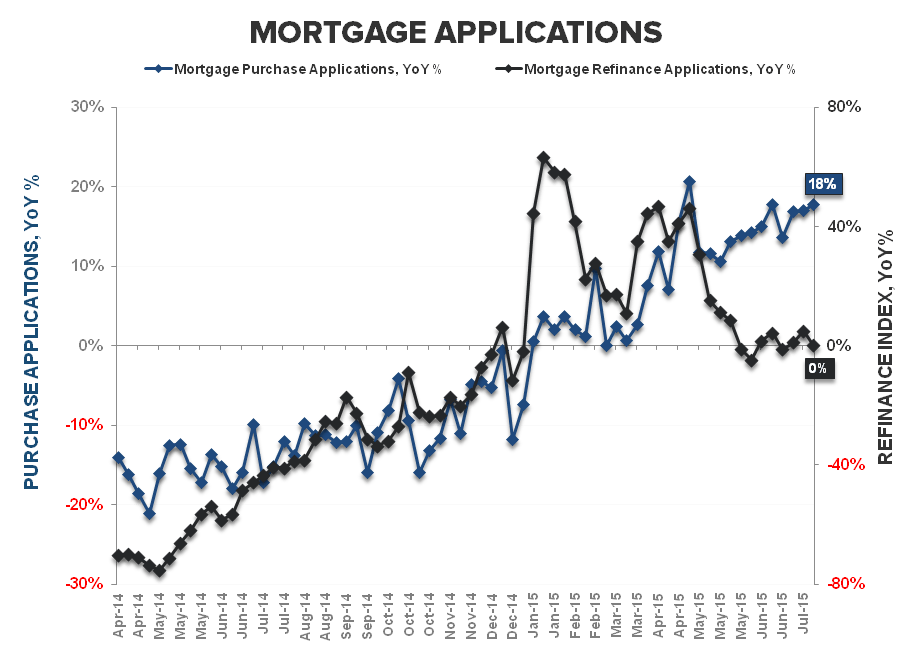
PHS vs EHS | Predicting the Present: The strength in June EHS was not unexpected and was well telegraphed by the multi-month strength observed in PHS. As we’ve highlighted repeatedly, Pending Home Sales are a strong leading indicator for Existing Home Sales and EHS re-coupling to PHS after short-term dislocations has been as high probability a call as one could make. The re-convergence between the two series is largely complete following the advance in EHS in June. We show the divergence-convergence trend over the last 18 months in the 1st chart below.
1st-time Buyers | Worse …. No, wait, Better .. it depends: Last month’s rise in 1st-time buyer share to 32% of sales (a 33-mo high) proved a quasi-headfake as their share of sales in June retreated moderately to 30%. Given the rise in total sales, the decline in absolute sales to 1st-time buyers was more modest and belies the magnitude of ongoing improvement for this demographic. Indeed, sales to 1st-time buyer are up a notable +17.4% YoY – a premium to the +9.6% YoY growth in EHS in aggregate as distressed/investor/cash sales continue to decline and the slow march to market normalization progresses. So long as labor/income fundamentals continue to improve and the employment recovery for 25-34 years continues to mature, headship rates among young adults should rise with single-family purchase demand manifesting on a lag. As can be seen in the 2nd chart below, mean reversion to 40% share for 1st-time buyers implies upside to >6.0 mm in EHS.
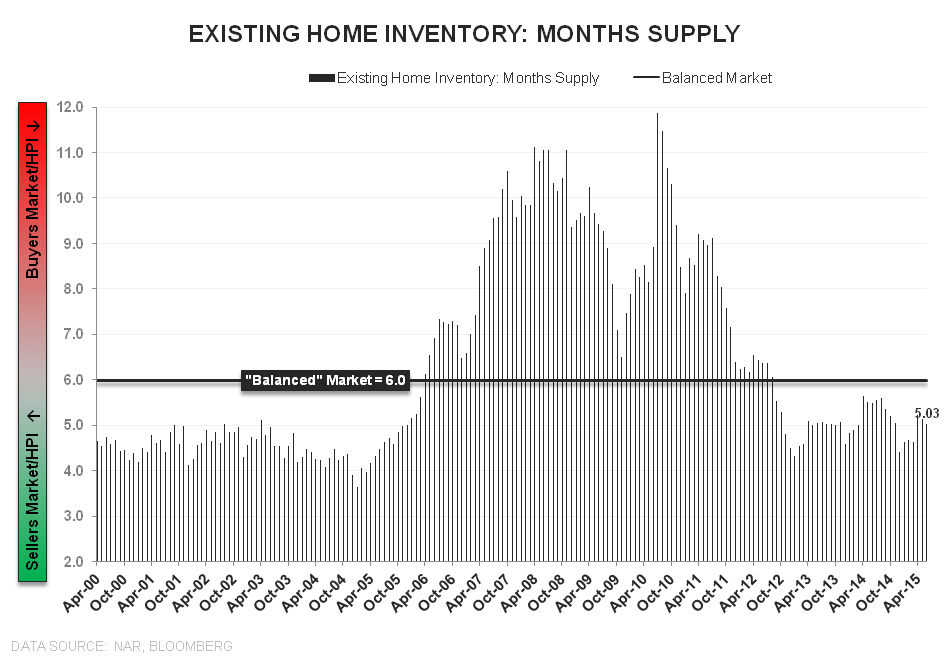
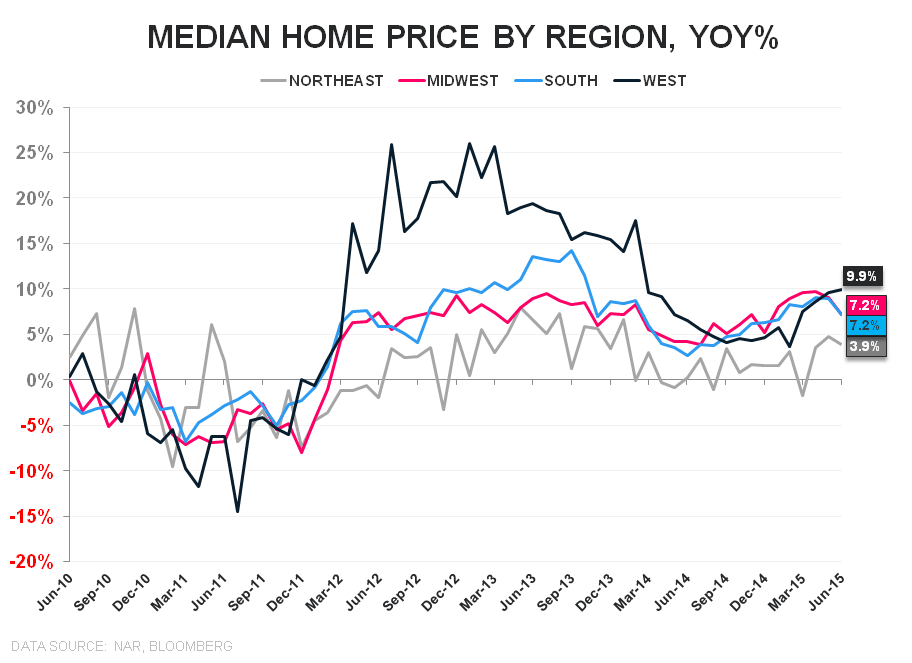
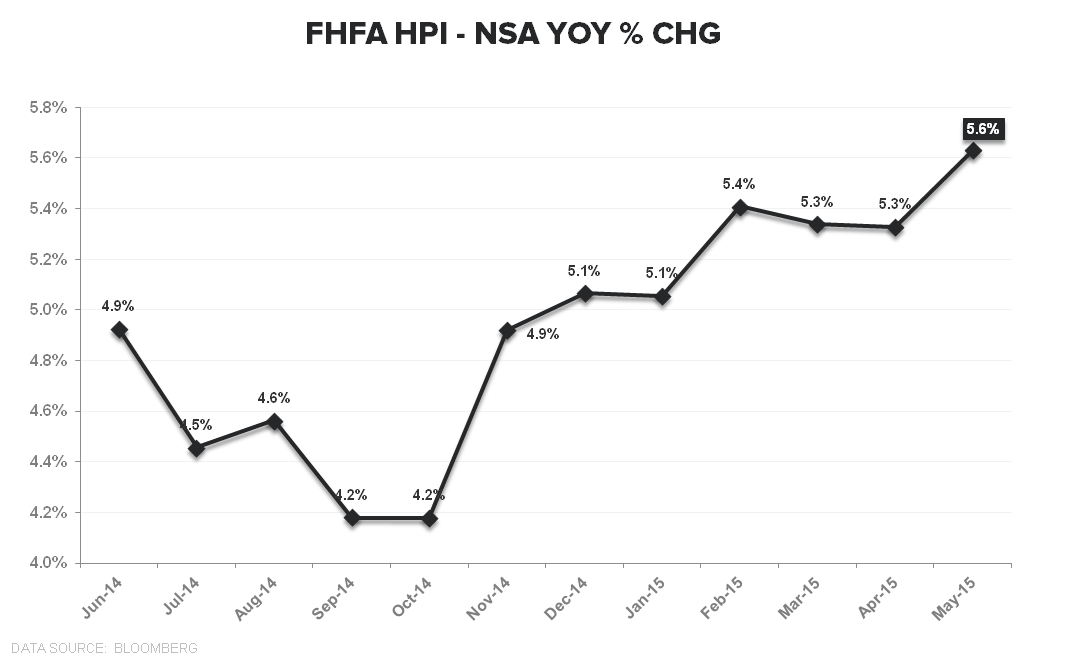
Inventory ↓ = Future HPI ↑: Units of inventory rose +0.9% MoM in June to 2.3 mm but with sales growing at a premium to supply for a second month, inventory on a month-supply basis dropped -2.2% to 5.03-months – representing a second month of tightening supply and the 34th month below the canonical balanced market level of 6-months. Tight - and tightening - supply in the 90% of the market that is EHS remains supportive of improving HPI trends. Indeed, the FHFA HPI series for June released this morning showed price growth accelerating +30bps sequentially to +5.6% YoY in June (vs +5.3% prior) and playing catch-up to the (more leading) CoreLogic HPI series which has shown accelerating improvement in each of the last 3-months. Improving 2nd derivative trends in HPI augurs positively for housing related equities given the strong contemporaneous relationship between the two.
Rates: Interest rates on the 30Y FRM contract held flat at 4.23% for a 3rd straight week. Rates remain -2.3% lower than the corresponding period last year with the current rate of 4.23% comparing to the full year 2014 average of 4.35% and the 1H15 average of 3.97%.
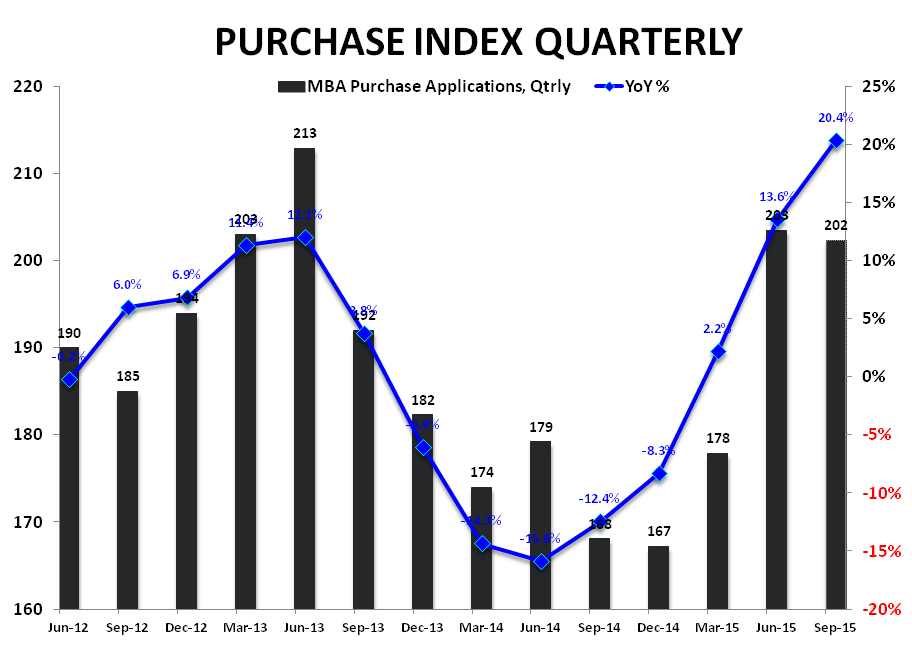
Purchase Applications = Less Noise, More Signal: Purchase applications rose +1.0% WoW while accelerating to +17.8% YoY, taking the index up to 198.3. Given the typical peri-holiday volatility in the data, this week represents the first clean read on underlying demand for 3Q. In short, transaction activity appears stable and roughly in line with the 2Q15 average.
While good on an absolute basis, flat sequentially in 3Q15 represents an end to the large-scale, positive reversal we’ve seen over the last ~3qtrs. Whether #Good Is Good Enough against harder comps and pervasive seasonality remains a tough call, especially with rates providing no discrete head or tailwind to affordability at current levels.


About Existing Home Sales:
The National Association of Realtors’ Existing Home Sales index measures the number of closed resales of homes, townhomes, condominiums, and co-ops. Existing home sales do not take into account the sale of newly constructed homes. Existing home sales account for 85-95% of all home sales (new home sales account for the remainder). Therefore, increases in existing home sales tend to signify increasing consumer confidence in the market. Additionally, Existing Home Sales is a lagging series, as it measures the closing of homes that were pending home sales between 1 and 2 months earlier.
Frequency:
The NAR’s Existing Home Sales index is published between the 20th and the 22nd of each month. The index covers data from the prior month.
About MBA Mortgage Applications:
The Mortgage Bankers’ Association’s mortgage applications index covers more than 75% of mortgage applications originated through retail and consumer direct channels. It does not include loans delivered through wholesale broker and correspondent channels. The MBA mortgage purchase applications index is considered a leading indicator of single-family home sales and construction. Moreover, it is the only housing index that is released on a weekly basis.
Frequency:
The MBA Purchase Apps index is released every Wednesday morning at 7 am EST.
Joshua Steiner, CFA
Christian B. Drake
