Editor's Note: This is an excerpt and chart from today's Early Look. It was written by Hedgeye CEO Keith McCullough. Click here to learn more and subscribe.
...All the while, the market internals have looked scarier at each of those 3 market peaks. Here’s how yesterday’s looked:
- PRICE – SPY (SP500) +0.08% yesterday vs. RUT (Russell 2000) -0.52% = bearish divergence
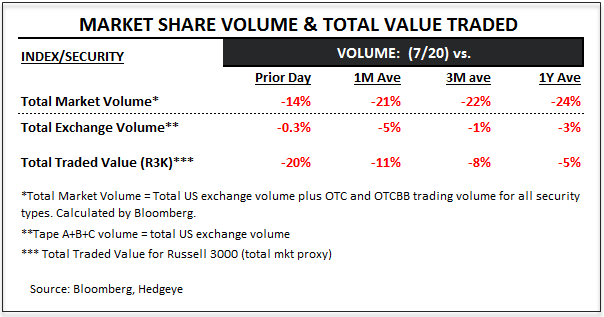
- VOLUME – Total US Equity Market Volume (see Chart of The Day) -21% and -24% vs. its 1-mth and 1-yr averages
- VOLATILITY – front-month VIX not being able to close below 12 for the 3rd time in the last 3 months