

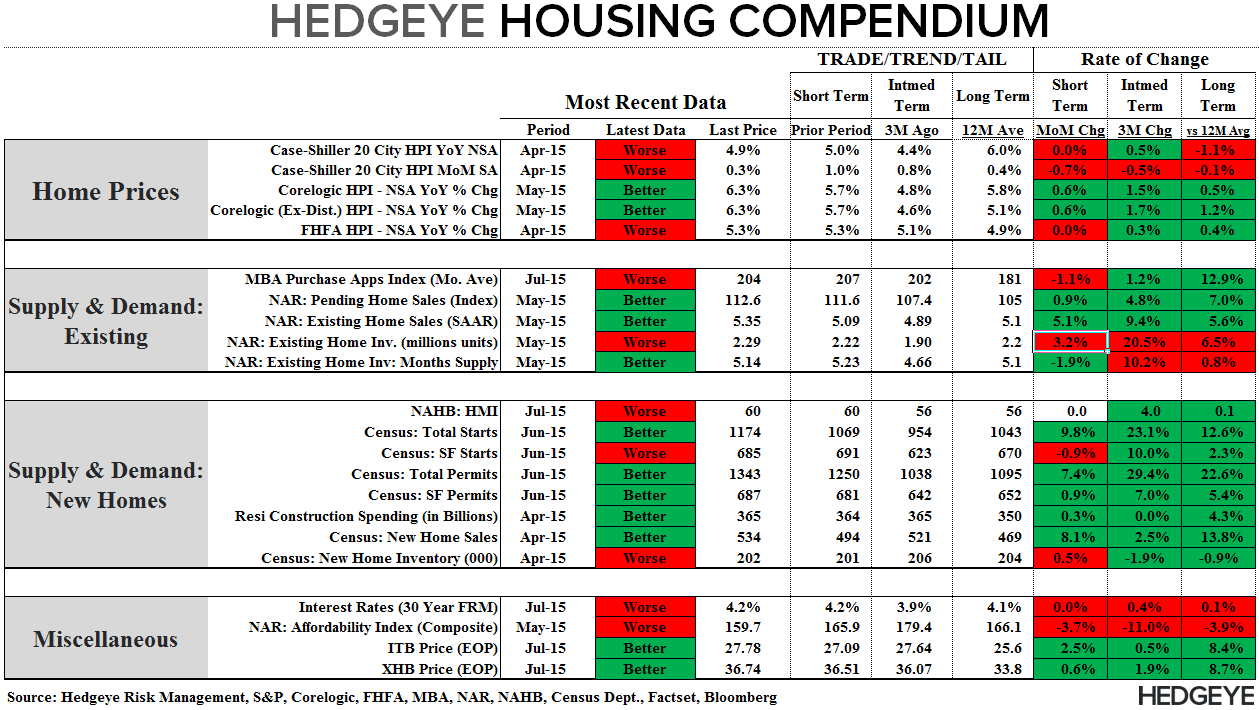
Our Hedgeye Housing Compendium table (below) aspires to present the state of the housing market in a visually-friendly format that takes about 30 seconds to consume.
Today’s Focus: June Housing Starts & Permits
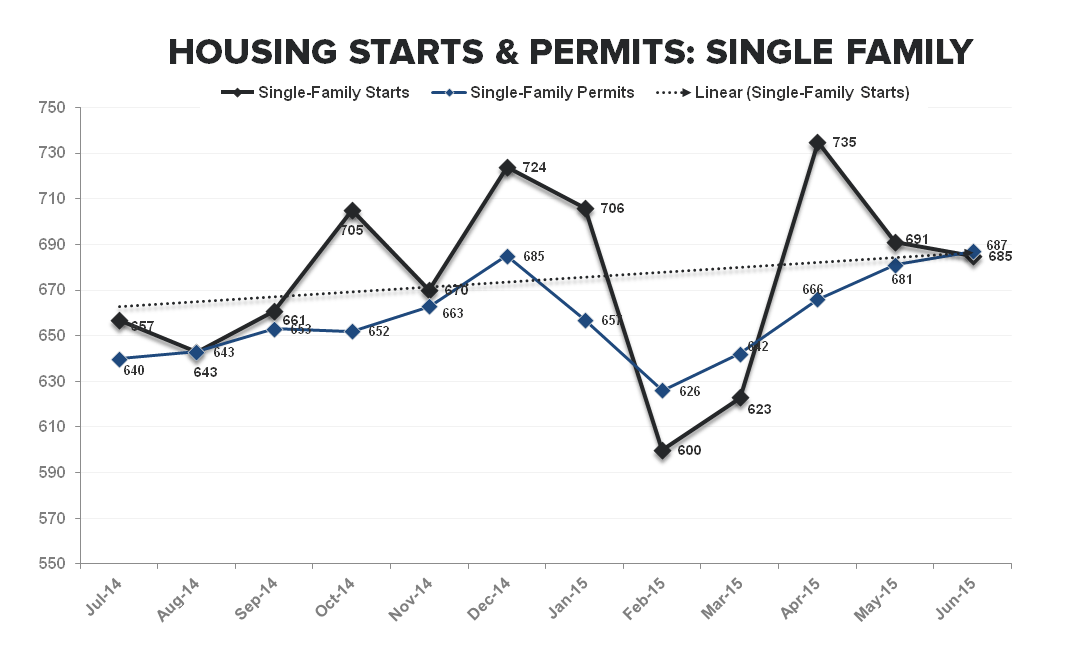
The Capriole: A sharp pop in multi-family construction and permitting in June led a return to post-crisis highs in Total Starts, a 27-year high in multi-family Starts and a 42-year high in multi-family share of total. While declining a modest -6K sequentially and decidedly less epic than the +30% sequentially and +48% YoY gain in MF, single-family starts remained near cycle highs at +685K, accelerating to +15% YoY from +8% prior.
The Caveat: The sunsetting of tax exemption programs in NYC in June and its role as an exogenous amplifier of multifamily activity has garnered some headlines the last couple months. The 1st set of charts below from the NYU Furman Center – citing NYC Building Department data – show a discrete spike in large-scale project permits into the impending expiration. Along with the outsized magnitude of increase, the data supports the notion that the expiration provided a modest juicing to the June figures.
The Conclusion: The trend in SF starts/permits, therefore, probably offers the cleanest read on the underlying level of activity and, with SF starts up +9% in 1H15 relative to 1H14, the trend there remains one of ongoing, moderate improvement.
The Comps: Looking ahead, the comp setup and read-through to reported rates-of-change is very much duration dependent. In the short-to-medium term, growth comps get decidedly more difficult beginning in July and remain tough through the balance of 3Q.
From a longer-term perspective, however, new single-family construction and sales remain the most depressed of all activity metrics across both the New and Existing Markets with new construction activity over the last year (i.e. inclusive of the multi-family recovery) barely above trough levels observed across prior cycles. As it stands, Housing Starts remain at just 45% of prior peak levels. The immediate-term comp dynamics and longer-term mean reversion opportunity are illustrated in charts 3&4 below.


About Housing Starts & Permits:
The US Census Bureau records the number of new housing units that have obtained permits for construction and those that have begun construction. This data includes new buildings intended primarily as residential units. The US Census Bureau defines a start as, “Start of construction occurs when excavation begins for the footings or foundation of a building.”
Joshua Steiner, CFA
Christian B. Drake
