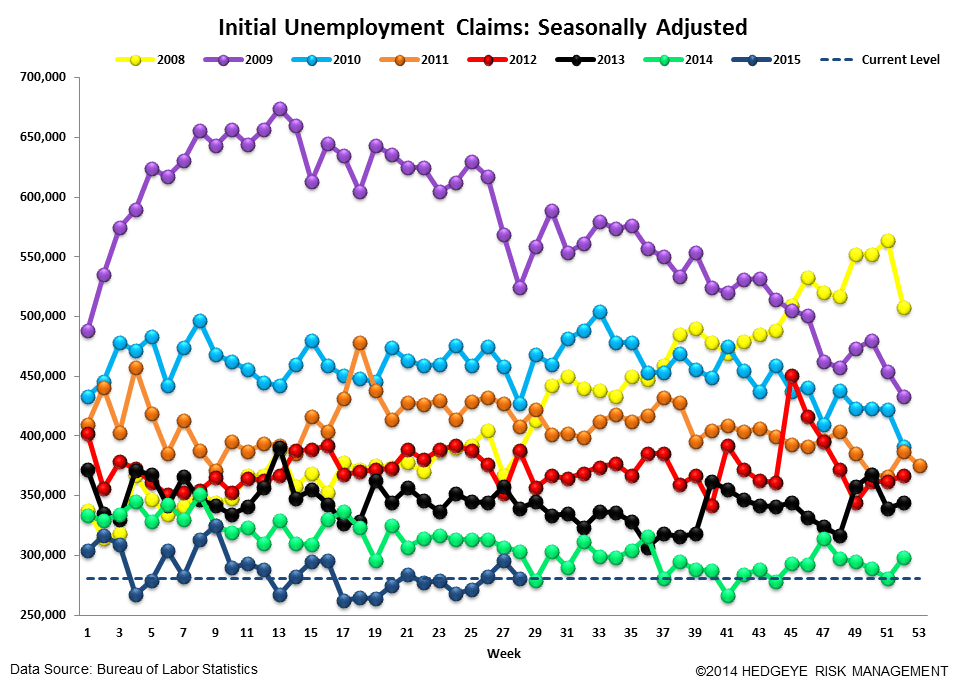
As we foreshadowed last week, the post-auto furlough labor environment proved more even-keeled as claims retraced their prior week bounce and have settled back into their now 16-month trend at sub-330k.
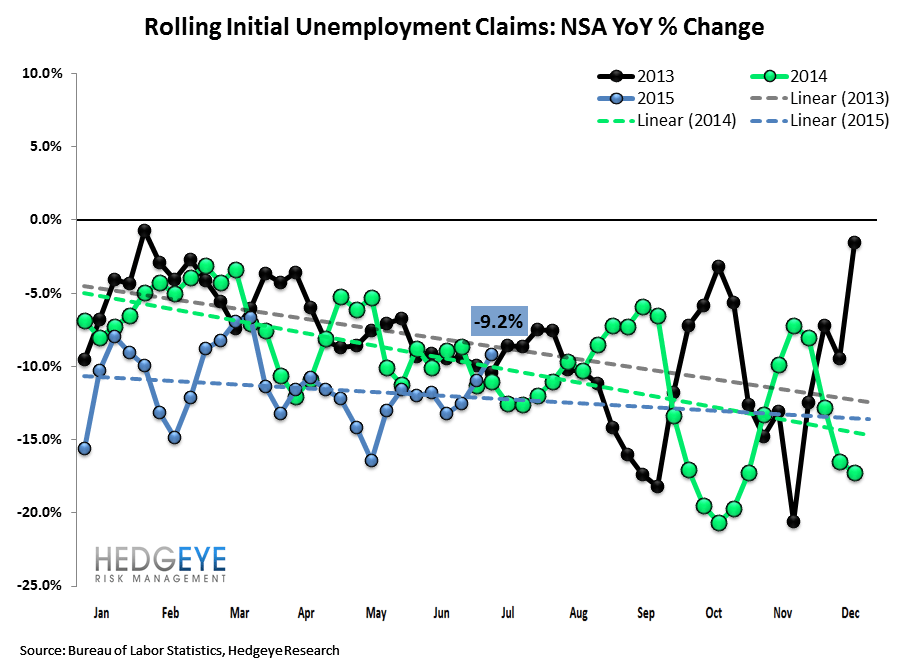
Rate of change in Y/Y improvement is beginning to converge towards zero, a not unexpected dynamic as we approach the lapping of the frictional lower bound in claims. RoC in Y/Y claims slowed to -9.2% from -11% in the prior week and will likely be at or near zero within a few months. This, in and of itself, is not a sign of deterioration in the labor market, just as the worsening rate of change in going from 3 mice to 0 mice to 0 mice in the house is not a sign of things worsening. That said, it is yet another reminder that we're late cycle. Once things bottom out from a RoC standpoint it becomes a "how long" until the end proposition.
On the energy side of things, there was a lagged distortion in the numbers making their usefulness not especially high. While the chart below appears to show marked improvement in the labor conditions of energy states relative to the US as a whole, this is misleading because the auto furloughs occur in non-energy states like Michigan and Ohio. Taking into account the one-week lag on the state specific data, it's clear that we're seeing an artificially positive convergence created by auto plant re-tooling and not a rebound in the energy labor market. Next week should show a more realistic representation of what's happening on the energy front.

The Data
Prior to revision, initial jobless claims fell 16k to 281k from 297k WoW, as the prior week's number was revised down by -1k to 296k.
The headline (unrevised) number shows claims were lower by 15k WoW. Meanwhile, the 4-week rolling average of seasonally-adjusted claims rose 3.25k WoW to 282.5k.
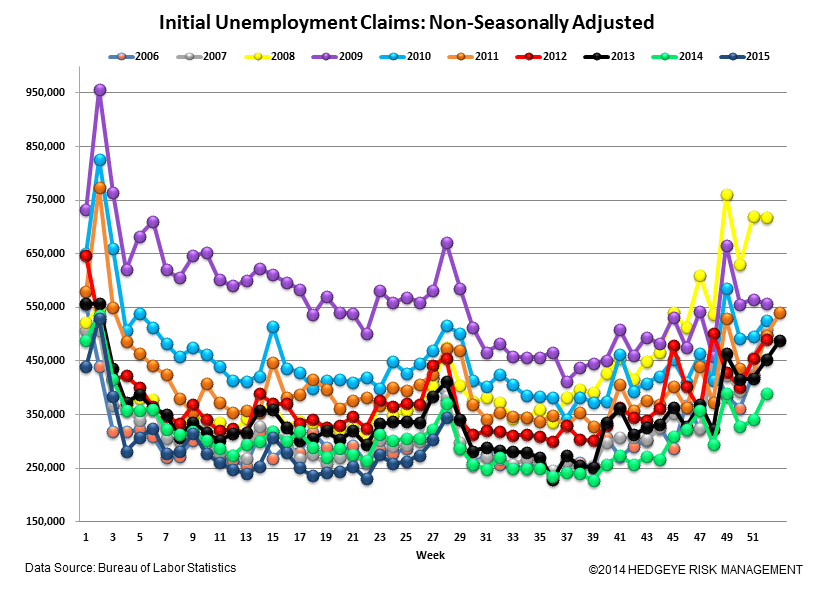
The 4-week rolling average of NSA claims, another way of evaluating the data, was -9.2% lower YoY, which is a sequential deterioration versus the previous week's YoY change of -11.0%


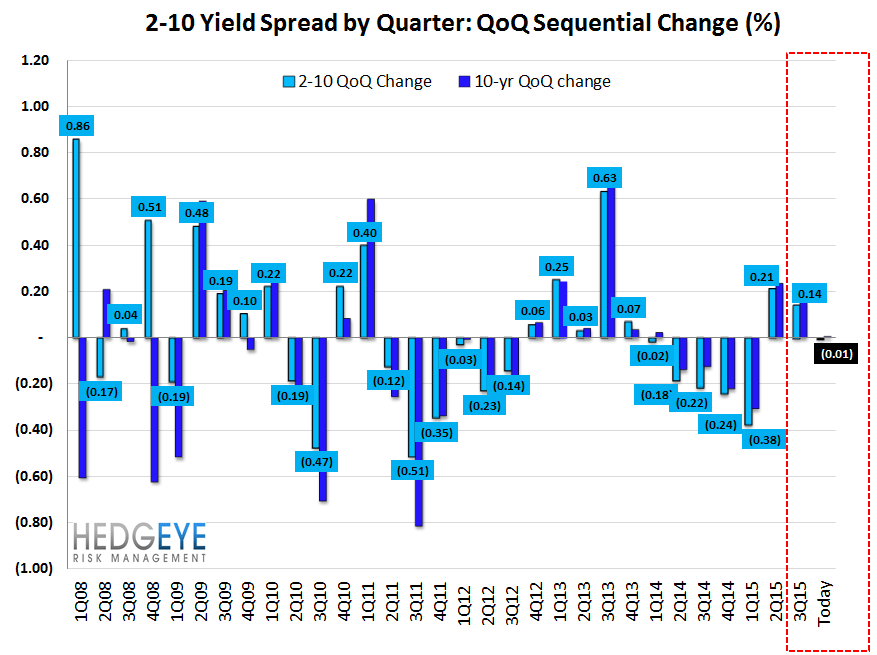
Yield Spreads
The 2-10 spread rose 7 basis points WoW to 172 bps. 3Q15TD, the 2-10 spread is averaging 173 bps, which is higher by 14 bps relative to 2Q15.

Joshua Steiner, CFA
Jonathan Casteleyn, CFA, CMT