Black Box Sales, Traffic
Black Box released same-restaurant sales and traffic estimates for the month of June last week that showed a strong acceleration versus a weak performance in the month of May. Same-restaurant sales grew to +2.1% up 100 basis points (bps) sequentially, and 200 bps YoY and same-restaurant traffic decreased -1.5%, an 80 bps sequential improvement, and up 20 bps YoY.


It appears that restaurants are continuing to raise prices despite declining commodity prices. While this is a short term benefit to margins, long term it is testing the elasticity of their customers. As you can see from the chart below, there is a clear divergence between the operators taking price and a decline in traffic. In June there is a minor uptick in traffic, and it will be interesting to see if this negative trend continues to reverse.

Knapp June Sales Trends
Knapp reported that comparable restaurant sales in June 2015 were +1.3% for same-store sales and -1.3% for guest counts. This represents a +20 and +60 basis point sequential improvement, respectively, for the month. On a 2-year basis, sales accelerated to +0.2% and traffic matched May’s 2-year average, down -2.0%.
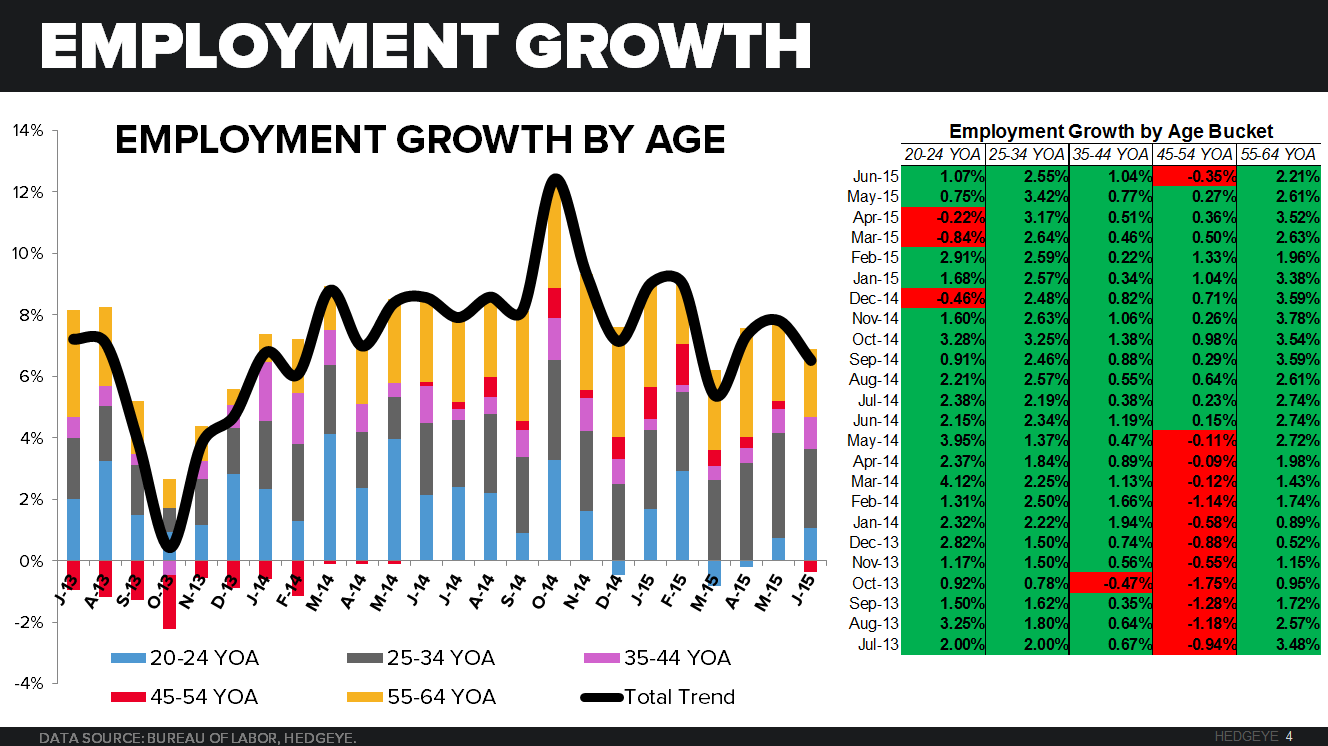
Employment Growth Slowing
The month of June was a mixed bag of results for employment. Employment growth continues to be largely attributable to the 25-34 YOA (+2.55%) and 55-64 YOA (+2.21%) which accounted for 39% and 34% of the growth, respectively. The downward trend is concerning, especially given that a large portion of the growth is in the 55-64 YOA cohort, with a considerable amount of that employment being part time.
June Employment Growth Data:
- 20-24 YOA +1.07% YoY; +32.6 bps sequentially
- 25-34 YOA +2.55% YoY; -86.1 bps sequentially
- 35-44 YOA +1.04% YoY; +26.9 bps sequentially
- 45-54 YOA -0.35% YoY; -62.5 bps sequentially
- 55-64 YOA +2.21% YoY; -40.1 bps sequentially
Thoughts from our macro team on June Retail Sales
Sequential slowdown on the Headline # in June – we knew the headline would decelerate sequentially given the slowdown in auto sales off of 10Y highs in May but this was worse than expected.
Headline: Down -0.3% MoM and decelerating on both 1Y/2Y
Headline: ex-Autos & Gas: Down -0.2% MoM, decelerating YoY and flat sequentially on a 2Y basis
Notables:
- Gas: Gas prices were up ~3% in June which translated to a +0.8% gain in Gas Station sales
- Auto’s: Auto’s & auto parts down -1.1% MoM. Vehicle sales were down -3.5% to 17.1mm units in June – down from May’s gangbusters 17.7MM figure (a 10Y and post-recession high)… vehicles sales were out on 7/1 so we already knew this
- Industry Momo: 9 of 13 Industries decelerated sequentially on a YoY basis
- I/S: We’ll get the I/S ratio’s a bit later but those continue to deteriorate with Inventories growing at a premium to sales
Words from our fearless leader (CEO) Keith McCullough on June Retail Sales
US Retail Sales “miss” (vs. sell side expectations) confirms our #LateCycle slowing view.