

Our Hedgeye Housing Compendium table (below) aspires to present the state of the housing market in a visually-friendly format that takes about 30 seconds to consume.

Today’s Focus: MBA Mortgage Applications
Data volatility is notoriously prevalent around holidays and seasonal adjustments are notoriously poor at fully resolving the peri-holiday choppiness in activity. Superficially, the last two weeks of Purchase Application data appear to support that notoriety.
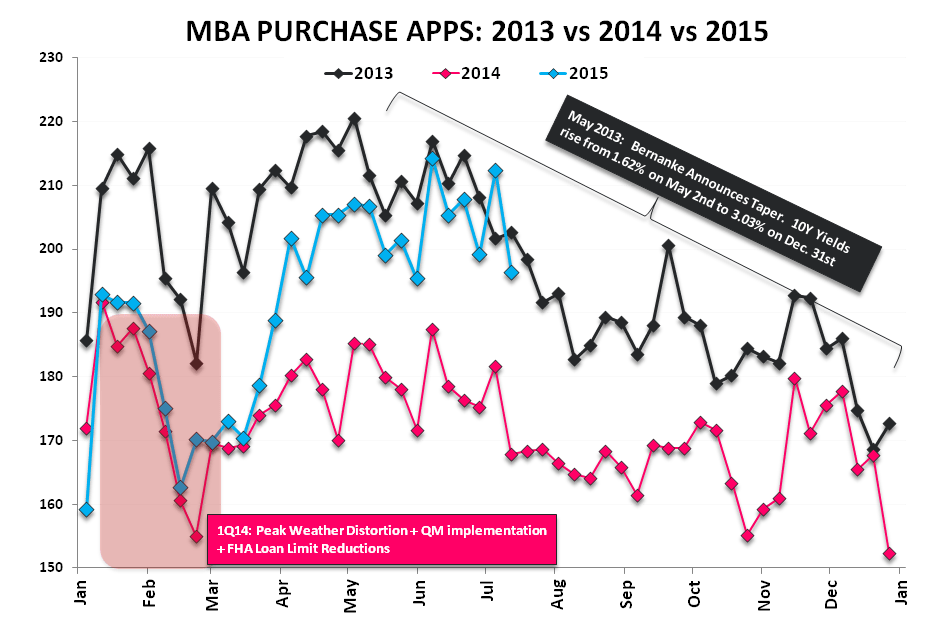
After rising +6.6% in the week ending July 3rd, Purchase Demand in the latest week declined -7.5%. We’re inclined to simply call it a wash and wait for next weeks data before attempting to discern any underlying shift in demand to start 3Q.
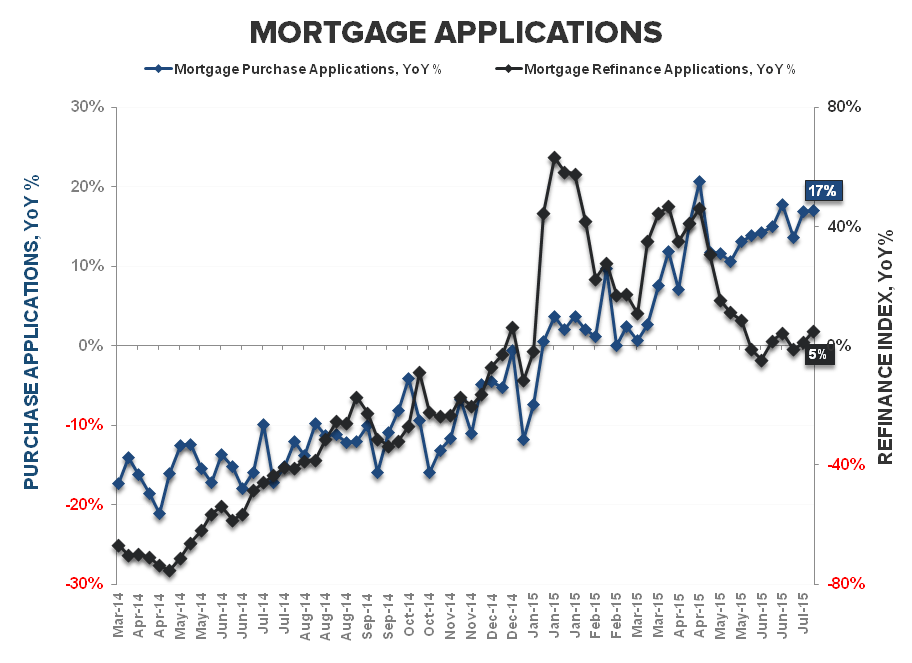
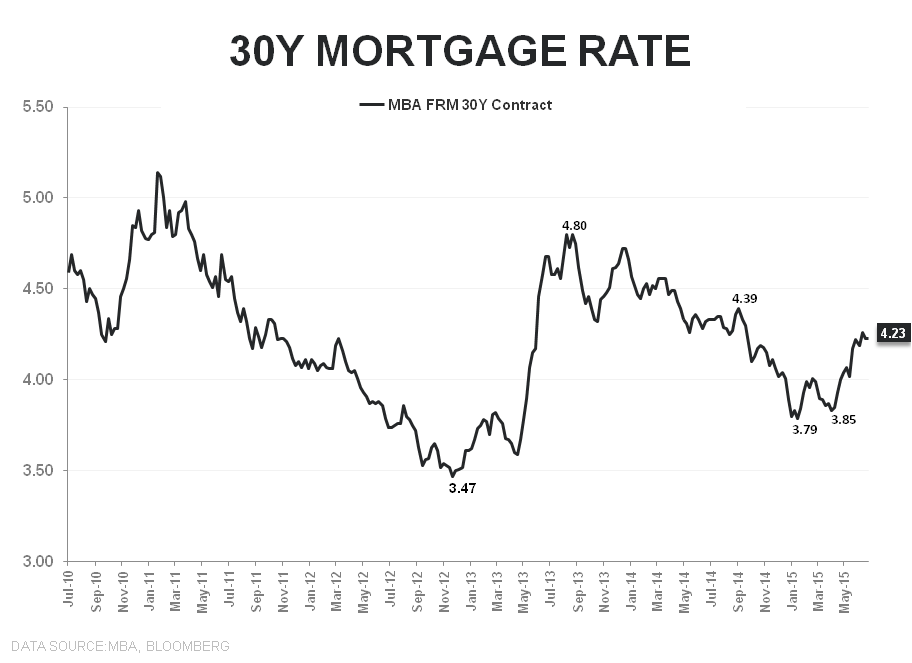
The Data: Purchase activity declined -7.5% in the latest week, taking the index back below the 200-level to 196.4. From a rate-of-change perspective, however, the data was more sanguine as growth actually accelerated +10bps sequentially to +17.0% YoY. Refinance activity, meanwhile, rose +3.7% with rates on the 30Y FRM contract steady for a second week at 4.23%. Rates remain -2.3% lower than the corresponding period last year with the current rate of 4.23% comparing to the full year average of 4.35% and the 1H15 average of 3.97%.
In short, the high-frequency Purchase Demand data remains good on an absolute basis and very good on a rate of change basis but the holiday convolutes a clean reading of the trend to start 3Q. Hurry Up and wait.


About MBA Mortgage Applications:
The Mortgage Bankers’ Association’s mortgage applications index covers more than 75% of mortgage applications originated through retail and consumer direct channels. It does not include loans delivered through wholesale broker and correspondent channels. The MBA mortgage purchase applications index is considered a leading indicator of single-family home sales and construction. Moreover, it is the only housing index that is released on a weekly basis.
Frequency:
The MBA Purchase Apps index is released every Wednesday morning at 7 am EST.
Joshua Steiner, CFA
Christian B. Drake
