Editor's Note: The chart and excerpt below are from today's Morning Newsletter written by Hedgeye CEO Keith McCullough. Click here if you would like more info on how you can subscribe.
...In terms of levels (they matter):
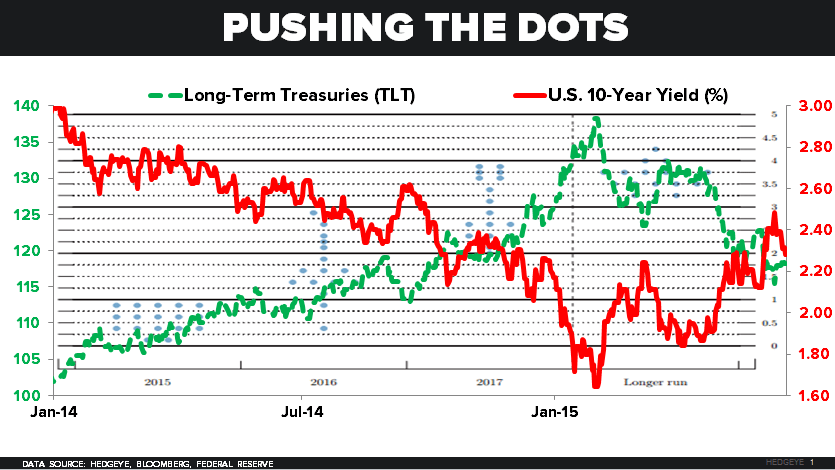
- The 10yr US Treasury Yield has just made yet another epic long-term-lower-high (we’re 18 months into this)
- The 2yr US Treasury Yield has now failed to “breakout” from the 0.75% level for the 3rd time since December
- My Risk Range model (which I use to front-run volatility) is signaling a narrowing (rather than widening) range