Editor's Note: The excerpt and chart below are from this morning's note written by Hedgeye Director of Research Daryl Jones. For information on how you can become a subscriber click here.
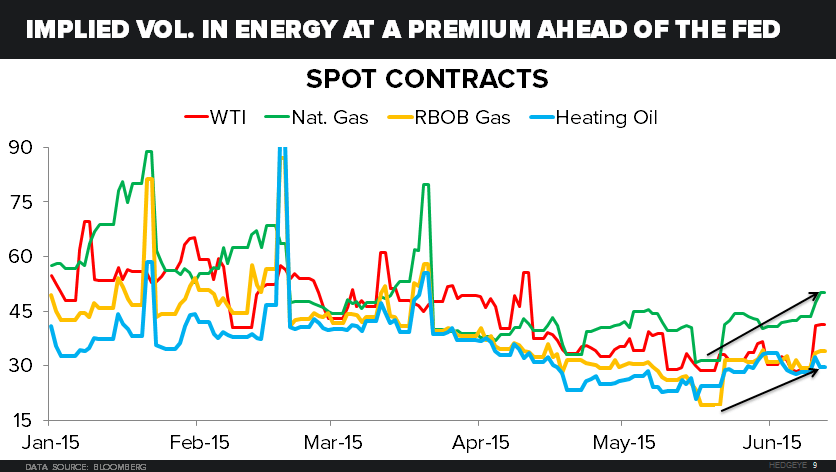
...Speaking of volatility, my colleague and resident Hedgeye energy analyst Ben Ryan put together an interesting Chart of the Day this morning on commodity volatility. While much has been made about the increased volatility on the bond market over the course of the year, volatility in the commodity market has remained somewhat muted this year.
The chart shows two key things. First, specifically related to energy based commodities, their volatility typical spikes into FOMC announcements. Second, these same commodities are near their lows of the year in terms of implied volatility. So, what do you think, is the world of energy commodities going to get more or less volatility in coming months?