Any time we see a breakout above an intermediate term TREND line, its bullish. In this case, for US Equities at least, a TREND line breakout in the VIX is also bearish.
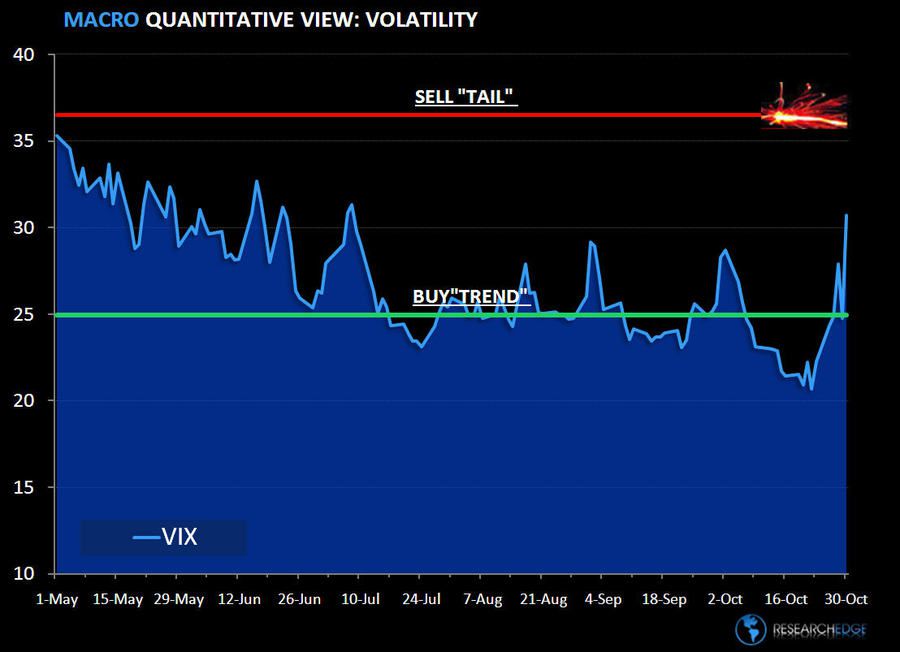
In the chart below, Matt Hedrick and I have outlined the context of what a +38% weekly spike in Volatility looks like. You will note that the VIX is now trading in what we call no man’s land – in between the long term TAIL (36.59) and the intermediate term TREND (24.93).
What’s most interesting about this chart is that since stocks put in their bottom in Q1, a range of 25-35 for the VIX is actually normal.
Provided that the US Government continues to sponsor ZERO percent free money policies and the blowing up and popping of price balloons, I see no reason why this New Reality of a Volatility Party shouldn’t remain.
KM
Keith R. McCullough
Chief Executive Officer