
Traditionally, strong employment trends would suggest a healthy sales environment for restaurant operators. There continues to be a clear divergence between improvement in the employment data and same-store sales and traffic trends for the industry.
Black Box Sales, Traffic
Black Box released same-restaurant sales and traffic estimates for the month of May last week that showed a slight deceleration versus an improved April. Same-restaurant sales retracted to +1.1% and same-restaurant traffic decreased -2.3% both down 80 basis points sequentially, and down 60 bps each on a 2-year basis.

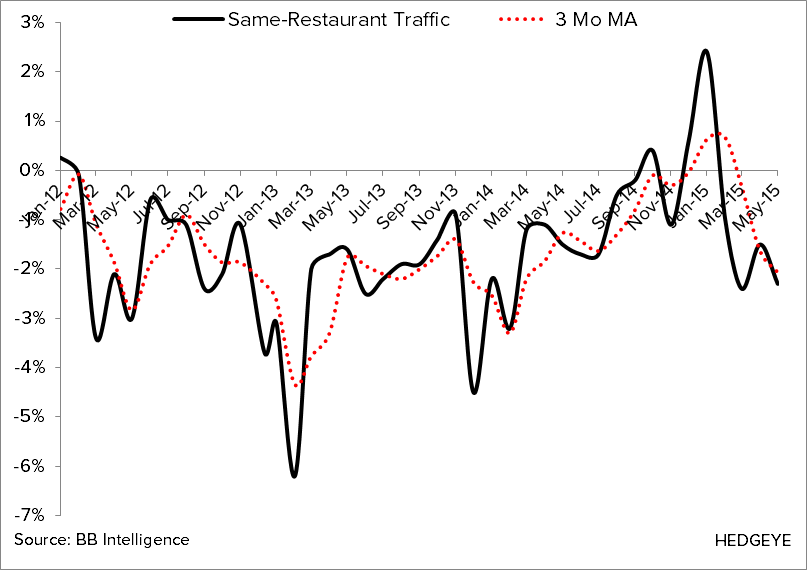
It appears that restaurants are continuing to raise prices despite declining commodity prices. While this is a short term benefit to margins, long term it is testing the elasticity of their customers. As you can see from the chart below, there is a clear divergence between the operators taking price and a decline in traffic.

Knapp May Sales Trends
Knapp reported that comparable restaurant sales in May 2015 for 5 weeks were +0.9% for same-store sales and -2.0% for guest counts. This represents a -10 and -40 basis point sequential slowdown respectively for the month. On a 2-year basis, sales slowed to +0.1% and traffic down -2.0%.
Strong Employment Data in All Age Groups
All age groups had positive employment growth during the month, highlighted by the 25-34 YOA group up 3.42%. As predicted last month, the sequential improvement seen in April in the 20-24 YOA group resulted in an impressive move to positive territory in May, up +0.75% versus last month down -0.22%. The older age groups 45-54 and 55-64 saw sequential deceleration of -8.9 and -90.3 bps respectively but still remain strong. These are very encouraging numbers for the restaurant industry, and we hope to see this trend continue through the summer.
May Employment Growth Data:
- 20-24 YOA +0.75% YoY; +96.1 bps sequentially
- 25-34 YOA +3.42% YoY; +24.9 bps sequentially
- 35-44 YOA +0.77% YoY; +25.4 bps sequentially
- 45-54 YOA +0.27% YoY; -8.9 bps sequentially
- 55-64 YOA +2.61% YoY; -90.3 bps sequentially

