
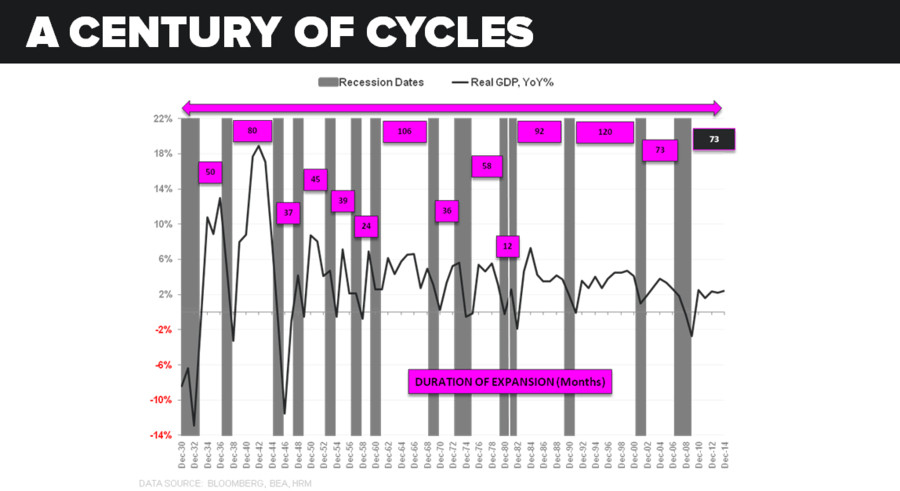
A CENTURY OF CYCLES: In our 2Q15 Macro Themes presentation we profiled the historical economic cycles of the last century, catalogued a selection of late-cycle indicators and contextualized the current expansion within the historical experience.
Canonical Macro cycles, left to themselves (i.e. with central banks following a largely passive policy reaction function), follow a pattern that largely resembles the circular, counter-clockwise flow captured in the inflation-output loop depicted in the chart below.
Conventional monetary policy is designed to function within the context of this naturally evolving cycle. The broader goal of current policy efforts is to both jump-start and (perhaps discordantly) smooth such a cycle in the face of persistent cyclical challenges and sectoral/secular shiftings.

“PATIENCE” - TOPS ARE PROCESSES: The halcyonic days of the late-cycle invariably birth discussion about whether it is, in fact, different this time, whether the economic cycle actually matters to stocks over protracted, investible periods of time and whether great central-bank catalyzed volatility moderations can matriculate into perma-profiteering opportunities.
The “It’s different” tag-line holds credence to the extent it refers to using the temporal pattern of typical business cycle oscillations as the appropriate anolog for the current expansion. Indeed, a defining characteristic of financial/balance sheet crises is the muted and crawling pace of the subsequent recovery. ‘Lower in Amplitude and Longer in Period’ is the periodic function speak we’ve used to describe the likely macro path over the last 2 years.
As it stands, we’re now 73-months into the current expansion – which compares to a mean of ~60 over both the last century and post-war era. What’s worth re-remembering is the fact that, on average, it takes between 6.5 and 8 years to reach pre-crisis levels of income following a financial crisis. In the current cycle - real per capita income in the U.S. reached pre-crisis levels at the end of 2013, so just about 6 years from the onset of the recession.
So, even with unprecedented intervention and global policy coordination we still fell basically right on the average. This time, in fact, was not particularly different.


PROFITS PAST-PEAK? As Keith referenced in an institutional highlight yesterday - during the 2000 and 2007 economic (and profit cycle) slow-downs, Wall St ramped M&A/IPO/Buyback activity to levels never seen before. I.e. the ramp in “everything is different” was happening to offset the cyclical slowdowns.
Corporate Profits peak mid-to-late cycle and the last few quarters of data suggest we’re probably past peak in the current cycle. Past peak profitability in combination with companies facing prospective acceleration in wage inflation, a continued dearth in aggregate global demand and the ongoing secular retreat in the worlds core consumption demographic of 35-54 year olds is not a factor cocktail supportive of a step function rise in capex.

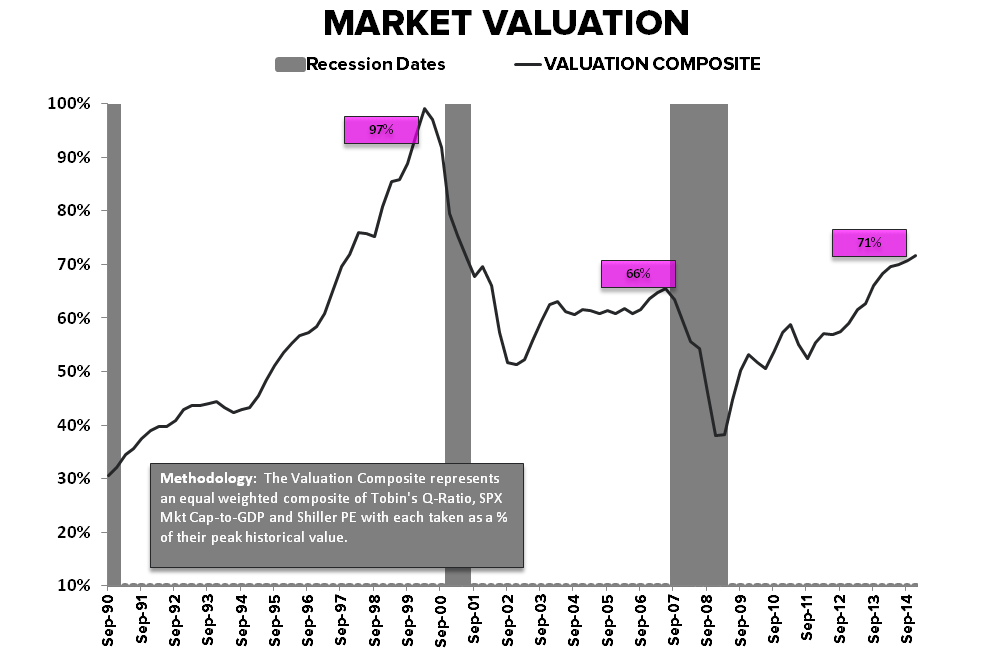
VALUATION IS NOT A CATALYST…BUT IT IS A DECENT HARBINGER:
Valuation is not a catalyst and investor’s maintain varying proclivities for particular multiples and conceptual valuation frameworks. There is good debate to be had regarding the superiority or shortcoming of different multiples but there is a more general point to be made about current levels of valuation.
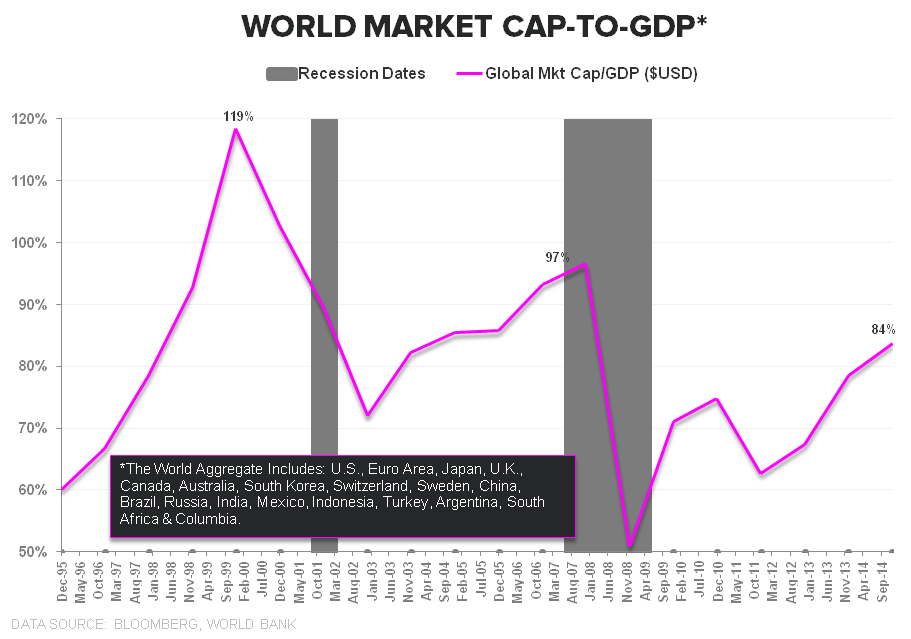
Looking across the selection of metrics below, broadly, current valuations are richer than pretty much at any point except the nose bleed tech bubble highs. Lower neutral policy rates and perma central bank interventionism may indeed be supportive of higher mean valuations but that only modestly dilutes the conclusion. When valuations are in the top decile of LT historical averages, subsequent returns over medium and longer-term periods are just not that compelling.

LATE-CYCLE REALITIES:
Solving for what drives prices higher as profits flag is trivial. But if you’re going to be paying near-peak multiples on peak margins as margins appear to be past peak and the expansion enters its twilight, you should at least be aware that that’s what you are doing.
Tops are processes and “late-cycle” is not some discrete peak on a Macro sine curve. We’re continuing to move tactically while the music plays but we won’t be willfully blind to the #LateCycle reality of it all.
Christian B. Drake
@HedgeyeUSA
