

This note was originally published May 21, 2015 at 09:14 in Financials. For more information on our products and services click here.
Investment Company Institute Mutual Fund Data and ETF Money Flow:
ETFs recovered some lost ground from last week with equity ETFs taking in +$7.3 billion and fixed Income ETFs raising a fresh +$2.1 billion (versus a -$9.6 billion and a -$2.2 billion drawdown respectively last week). Year-to-date tallies however show bifurcated demand for passives with average weekly subscriptions in equity ETFs down 50% from 2014 versus trends in fixed income ETFs which have improved by nearly 25% year-over-year. Active equity mutual fund trends are painfully consistent with a continual bleed in domestic funds versus international equity funds which have constant fund raising. Domestic funds gave up another -$5.1 billion in redemptions, marking the 11th straight week of negative flows. Meanwhile, international mutual funds took in +$2.8 billion in the most recent 5 day period for their 19th consecutive week of subscriptions. Domestic stock fund percentages are highest at T. Rowe Price (TROW) and Janus Capital (JNS) which are exposed to this domestic category weakness versus stronger International exposures at Franklin Resources (BEN) and Affiliated Managers Group (AMG).

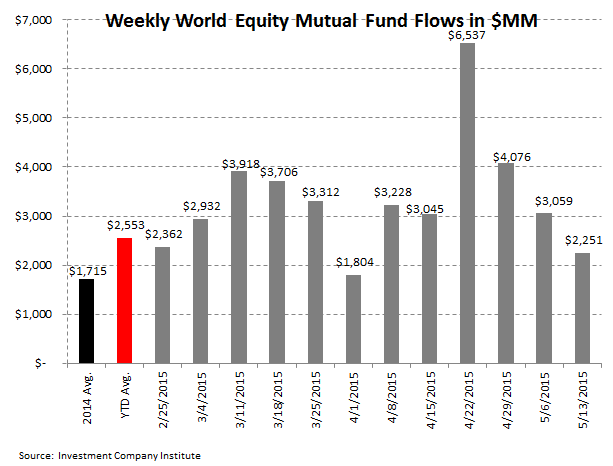
In the most recent 5-day period ending May 13th, total equity mutual funds put up net outflows of -$2.8 billion, trailing the year-to-date weekly average inflow of +$805 million and the 2014 average inflow of +$620 million. The outflow was composed of international stock fund contributions of +$2.3 billion and domestic stock fund withdrawals of -$5.1 billion. International equity funds have had positive flows in 48 of the last 52 weeks while domestic equity funds have had only 10 weeks of positive flows over the same time period.
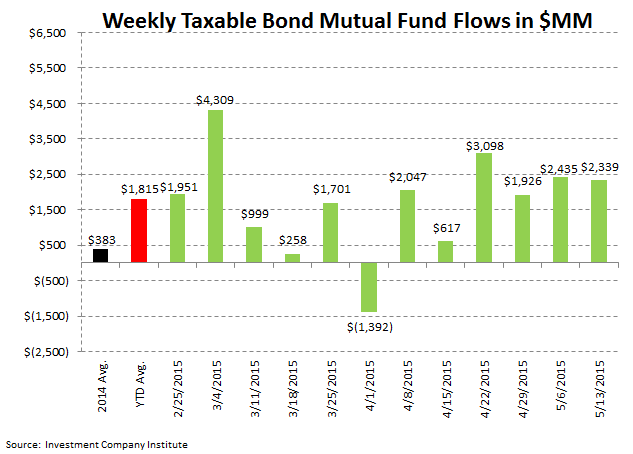
Fixed income mutual funds put up net inflows of +$2.2 billion, trailing the year-to-date weekly average inflow of +$2.3 billion but outpacing the 2014 average inflow of +$929 million. The inflow was composed of tax-free or municipal bond funds withdrawals of -$169 million and taxable bond funds contributions of +$2.3 billion.
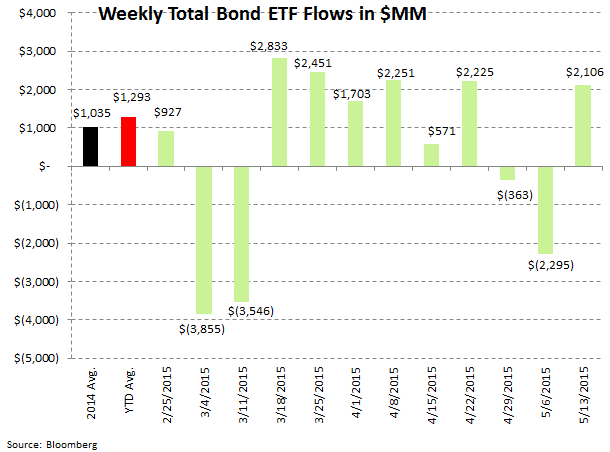
Equity ETFs had net subscriptions of +$7.3 billion, outpacing the year-to-date weekly average inflow of +$1.6 billion and the 2014 average inflow of +$3.2 billion. Fixed income ETFs had net inflows of +$2.1 billion, outpacing the year-to-date weekly average inflow of +$1.3 billion and the 2014 average inflow of +$1.0 billion.
Mutual fund flow data is collected weekly from the Investment Company Institute (ICI) and represents a survey of 95% of the investment management industry's mutual fund assets. Mutual fund data largely reflects the actions of retail investors. Exchange traded fund (ETF) information is extracted from Bloomberg and is matched to the same weekly reporting schedule as the ICI mutual fund data. According to industry leader Blackrock (BLK), U.S. ETF participation is 60% institutional investors and 40% retail investors.
Most Recent 12 Week Flow in Millions by Mutual Fund Product: Chart data is the most recent 12 weeks from the ICI mutual fund survey and includes the weekly average for 2014 and the weekly year-to-date average for 2015:


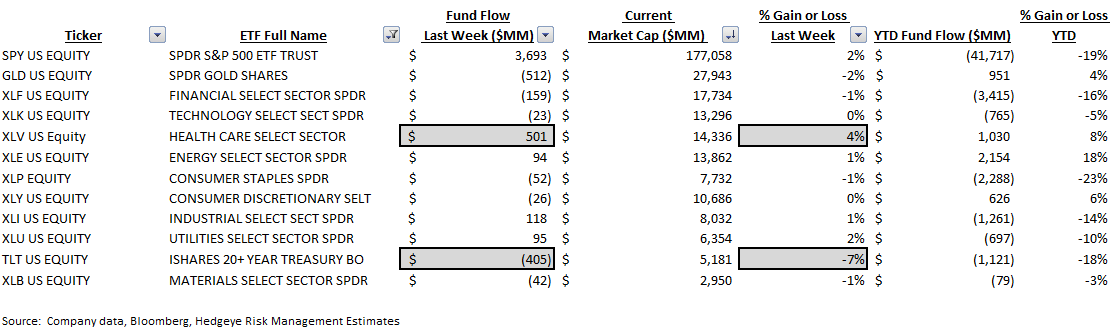
Most Recent 12 Week Flow Within Equity and Fixed Income Exchange Traded Funds: Chart data is the most recent 12 weeks from Bloomberg's ETF database (matched to the Wednesday to Wednesday reporting format of the ICI), the weekly average for 2014, and the weekly year-to-date average for 2015. In the third table are the results of the weekly flows into and out of the major market and sector SPDRs:

Sector and Asset Class Weekly ETF and Year-to-Date Results: In sector SPDR callouts, investors withdrew another -$405 million or -7% from the long treasury TLT ETF. Meanwhile, the healthcare XLV took in +$501 million or +4% in subscriptions.
Net Results:
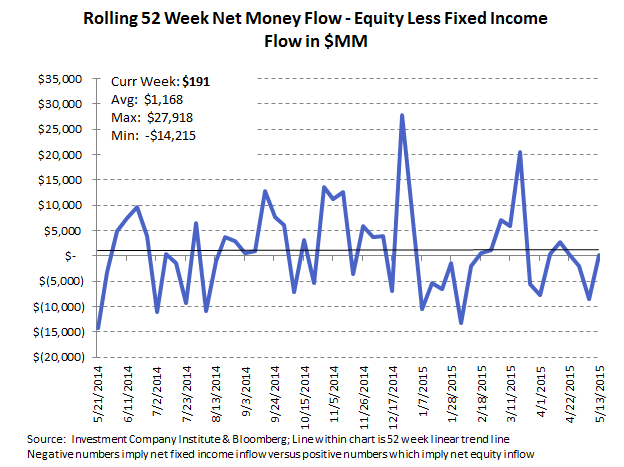
The net of total equity mutual fund and ETF flows against total bond mutual fund and ETF flows totaled a positive +$191 million spread for the week (+$4.5 billion of total equity inflow net of the +$4.3 billion inflow to fixed income; positive numbers imply greater money flow to stocks; negative numbers imply greater money flow to bonds). The 52-week moving average is +$1.2 billion (more positive money flow to equities) with a 52-week high of +$27.9 billion (more positive money flow to equities) and a 52-week low of -$14.2 billion (negative numbers imply more positive money flow to bonds for the week.)
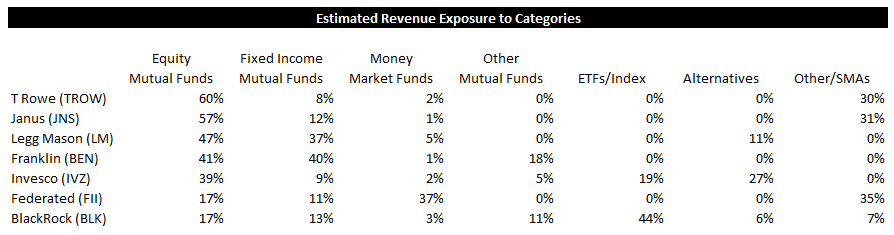
Exposures: The weekly data herein is important for the public asset managers with trends in mutual funds and ETFs impacting the companies with the following estimated revenue impact:
Jonathan Casteleyn, CFA, CMT
203-562-6500
Joshua Steiner, CFA
203-562-6500
