

This research note was originally published May 21, 2015 at 09:44 in Financials. Click here for more information on Hedgeye and how you can become a subscriber.
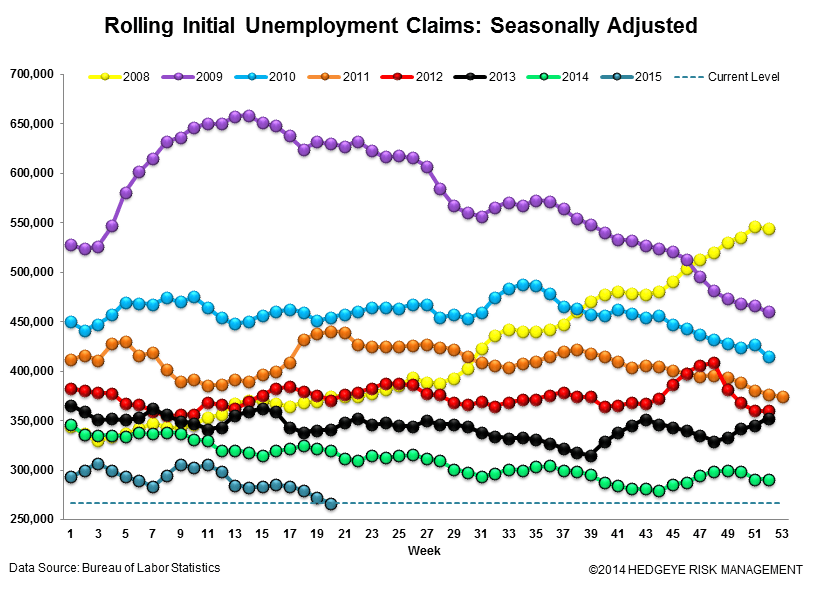
Seasonally adjusted jobless claims came in at 274,000 last week, slightly higher than expectations for 270,000. Even with the slight miss, this is a strong print. The rolling 4-week Seasonally Adjusted (SA) figure dropped to 266,300. This is the lowest rolling SA figure since the week ending April 15th, 2000, which also came in at 266,300.
In the first chart below, the 4/15/00 data is circled in red. It is important to bear in mind, though, that that date also corresponded to the peak in equities two cycles ago.
In the second chart below, indexed claims in energy heavy states improved more than the country as a whole in the week ending May 9th. The spread between the two series fell from 25 to 21.


The Data
Initial jobless claims rose 10k to 274k from 264k WoW, as the prior week's number was unrevised. Meanwhile, the 4-week rolling average of seasonally-adjusted claims fell -5.5k WoW to 266.25k.
The 4-week rolling average of NSA claims, another way of evaluating the data, was -16.5% lower YoY, which is a sequential improvement versus the previous week's YoY change of -14.2%

Joshua Steiner, CFA
203-562-6500
Jonathan Casteleyn, CFA, CMT
203-562-6500
