When we first began pounding the table about the relationship between the US Dollar and the equity market (“Breaking the Buck” Q1 09, “Burning the Buck” Q2/Q3 09 and our present “Bombed out Buck” thesis) what was a matter of debate has become consensus and it seems like every pundit on CNBC has been talking the subject up. We were early to the game on this call, we are also now likely to be among the first to walk off the court: as the facts change, so do we.
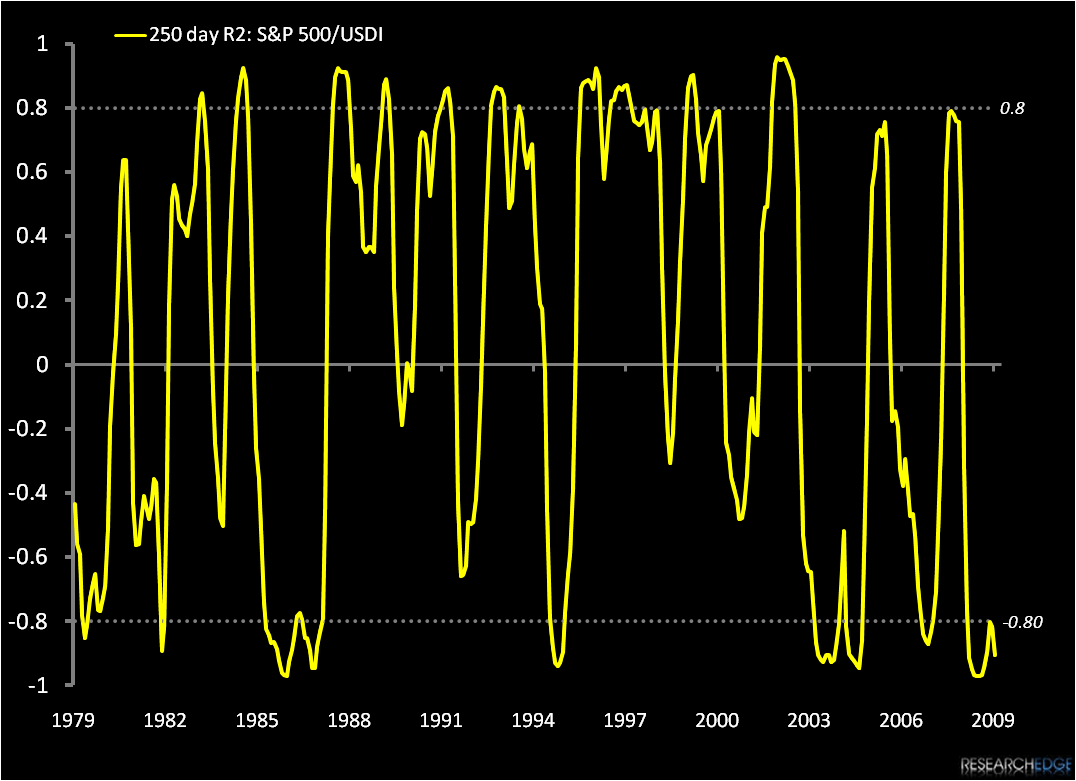
The reality is that over time the Dollar oscillates between a role as a driver and that of a reflection of the US asset markets (including equities) with great frequency. To help illustrate this point, I have put together the crude illustrations below. The chart shows the rough correlation between the S&P 500 and the US Dollar Index on a rolling 250 day basis.
As you can see, the relationship flips between strong positive and negative correlation with a very high frequency. In the background of the second chart I have charted a rolling measure of the absolute difference between year-over-year returns for the two indices to map out periods of long term performance convergence/divergence. Intuitively the periods of broadest divergence tend to coincide with period of strong negative correlation and vice versa (with the notable exception of Volker’s interest rate crusade in the early 1980’s).
Obviously there is a huge difference between calculating positive and negative correlation and understanding when the dollar is the driver for this, but it does serve to illustrate how volatile this relationship is.

Early this year we realized that the US Dollar was setting up to assume the role of equity market driver and the strong negative correlation between the two indices has proved us right. We now see the fundamental dynamic between shift starting and expect that –just as the USDI/SPX relationship can easily revert to a reflective measure as we move forward, so too can the correlation between the two weaken. This is supported by recent declines in shorter term r2 calculations.
Our point is simply, it would be a mistake to assume that the relationship between US equities and the dollar is static. Our process is one of risk management and a critical part of that is understanding when a trend is changing.
Andrew Barber
Director