Editor's Note: The chart and brief excerpt below are from today's Morning Newsletter written by Hedgeye CEO Keith McCullough. Click here to learn more about what we believe is the best daily market newsletter out there.
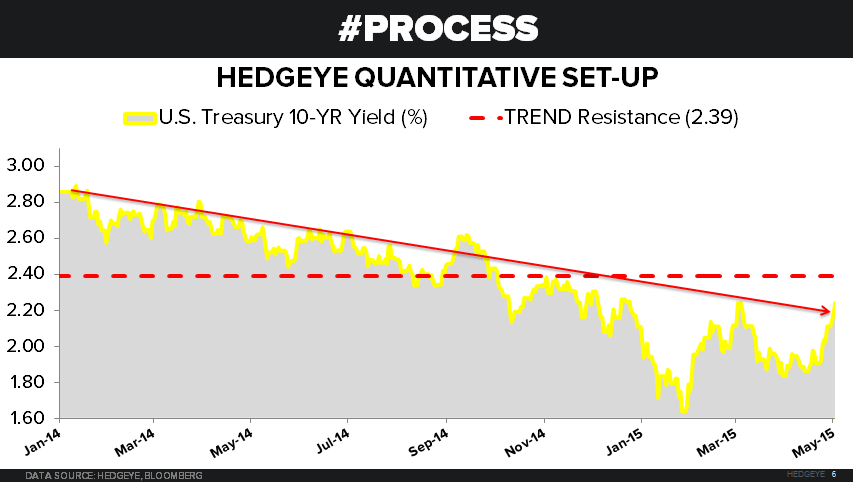
...No matter where you go this morning, here we are – in the midst of another “breakout” in US bond yields. Notwithstanding that this one has been caused by an epic breakout in Global Yields, US equity only guys looking at TLT have the “bearish chart” now inasmuch as they had the uber bearish Oil one down at $43/barrel.
Even though many of you were right on bond yields (lower-for-longer) for 16 months starting in January of 2014, if you remained bearish on bond yields at the 2015 lows like I did, you have been wrong (on bonds) for a month. And now the mob has you by the #charts, so it’s time to … uh, panic? ...