“A man willing to work, and unable to find work, is perhaps the saddest sight that fortune’s inequality exhibits under the sun”
-Thomas Carlyle
How many people must run from a crowded theater before the next person decides to run?
That’s the analogy Jim Rickards uses to anchor his discussion of critical state dynamics in complex systems in the prophetic Fx apocalyptic, Currency Wars.
Rickards uses it as the metaphorical underpinning to a hypothetical example of how a repudiation of the Dollar by some relatively small number of people could propagate to a population wide repudiation and full currency collapse.
I like the theater metaphor because it’s vivid, mentally tractable and widely transferrable - if some stimulus perturbs a system such that the system reaches a critical state, the signal/perturbation gets propagated and amplified as it moves downstream.
In short: some people run from the theater --> which cause more people to run from the theater --> everyone runs from the theater.
Power laws and critical state thresholds are, conceptually, pretty simple. And in describing the fundamental nature of a complex system, the lessons apply equally well to the Labor Market, Stock Market or interconnected Global Macro Markets as they do to the Currency Market.
It’s probably generally accepted (or perhaps not) that the evolution of macro modeling should endogenize complexity. So, why hasn’t it been done?
Mostly because the math needed to model network effects and signal propagation at the scale of Macroeconomies is (really) hard.
However, for those waiting (im)patiently on the ivory tower evolution away from static equilibriums and linear macro, the direction of current research is encouraging.
At a recent conference of the National Bureau of Economic Research Daron Acemoglu (MIT) et al presented the following paper: Networks and the Macroeconomy: An Empirical Exploration
If you’re interested – and fully caffeinated – it’s worth a read. Even if you don’t understand the math and techni-speak, the Abstract/Intro provides some layman friendly intuition for understanding the conceptual framework.

Back to the Global Macro Grind….
How many central banks need divergent policy paths to effect a step function rise in the dollar? --> What is the critical threshold on the dollar to propagate reflexive price action in commodity markets(i.e for things priced in dollars)? --> What is the critical price threshold on Crude to propagate a capitulation in financial demand (i.e. futures and options) for energy products and further price volatility? --> How much does the oil price have to drop to cause a collapse in energy sector capex and employment and a state-level recession in Texas? --> What’s the critical threshold for an industry level recession to catalyze a derailment of a broader jobs recovery domestically?
That flow of questioning is, of course, easier to generate largely after the fact.
While Financial markets and social media propagate and discount newsflow and events in real-time, frictions and inefficiencies cause the impacts of those events to flow through ‘real’ markets and government statistics on a lag.
Friday’s employment report provided the latest update on the net impact of the current set of dissonant global macro crosscurrents on the domestic labor market. We reviewed the data on Friday but a few area’s are worth re-highlighting
Energy Employment: Job loss in the energy sector extended into March/April according to both the BLS and Challenger Job Cut data. Oil & Gas extraction employment, which includes data thru April, saw a employment decline for a 3rd time in four months. Broader energy sector employment, which includes data thru March, showed a 5th consecutive month of net decline, dropping by -9K sequentially with the rate of YoY growth dropping to -0.6% - the first month of negative year-over-year growth in 58 months.
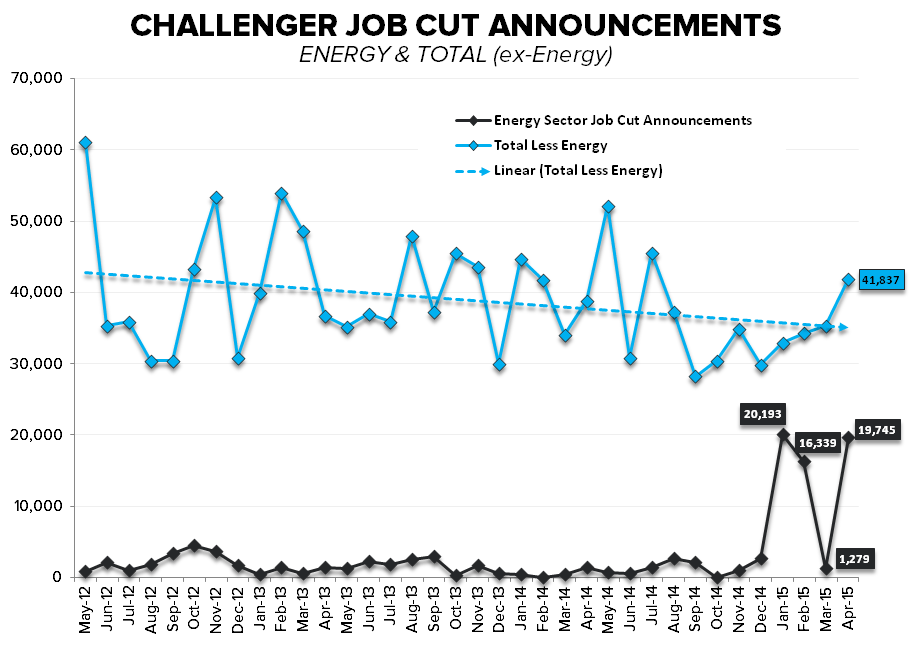
The weakness in the BLS report accords with the Challenger Job Cut data for April, see the Chart of the Day below, which showed energy sector job cut announcements re-ramping to +20K in April. Notably, collective net employment gains across our basket of eight energy states was -56K in March, the first delta negative month since September 2010, with the remarkable -26K decline in Texas leading job losses at the state level. For scale, the estimated -26K decline in Texas on an employment base of 11.7M would equate to an NFP print of -305K at the national level.
We’ll find out if the weakness portended by the Challenger data and emergent angst over a prospective state-level recession in Texas finds further traction in April with the release of the state level data on May 27th .
Housing: 25-34 year old employment growth made a higher cycle high from a rate-of-change perspective, accelerating +80bps sequentially to +3.2% year-over-year. Accelerating employment growth in this key housing demand demographic should continue to flow through to rising headship rates and housing demand at a modest-to-moderate rate. Further, Residential Construction employment rose +3K in April alongside the strong rebound in broader construction employment which was up a big +45K on the month as activity rebounded alongside the thaw in the weather.
The rebound in construction employment and activity in April along with the increased pace of household spending in the March PCE data offer some support to the deferred consumption (i.e. weather/etc) storyline in 1Q15, although the ongoing weakness in the factory sector sits as a material offset.
Income/Spending: With no change in hours worked and earnings growth up small sequentially, the moderate gain in total employment and modest positive mix in high-wage/low-wage employment on the month should be enough to support continued Trend improvement in aggregate income in April.
As we’ve highlighted, with income growth accelerating alongside the rise in the savings rate in recent months, the capacity for consumption growth has increased more than actual reported household spending. That trend showed a moderate reversal last month with income gains softening, savings declining and spending rising. Whether that latent spending power re-emerges remains TBD.
Indeed, consumption has some heavy lifting to do as consensus forecasts for accelerating PCE continue to buttress full year GDP growth estimates which remain at +2.8% despite what will be another 1st quarter of negative growth following the 1st revision to 1Q15 GDP.
For investors, the labor market rubber ultimately meets the road in terms of expectations around the path of monetary policy. With the market having already pushed out rate hike expectation to September, the April employment report probably does little to shift that, although the bond market response on Friday looked to be discounting policy conservatism, at the margin.
More broadly, the return to middling employment growth – and the discrete lack of either collapse or escape velocity improvement – will mostly serve to perpetuate further policy uncertainty, and asset class volatility by extension, as another month is devoted to over-speculation and spurious investor activity in the attempt to front-run a Fed faced with equivocal data and a data-dependence mandate.
Uncertainty breeds opportunity. Profitably exploiting that opportunity stems from front-running the inflection or patiently awaiting the catharsis. Our cash position in the Hedgeye Asset Allocation model remains at 6-month highs.
Our immediate-term Global Macro Risk Ranges are now:
UST 10yr Yield 1.87-2.25%
SPX 2095-2127
VIX 11.86-15.76
USD 94.01-96.17
Oil (WTI) 54.32-61.90
Gold 1168-1204
Best of luck out there,,
Christian Drake
U.S. Macro Analyst