

This note was originally published April 30, 2015 at 12:23 in Financials. For more information on how you can subscribe to our various products click here.

Investment Company Institute Mutual Fund Data and ETF Money Flow:
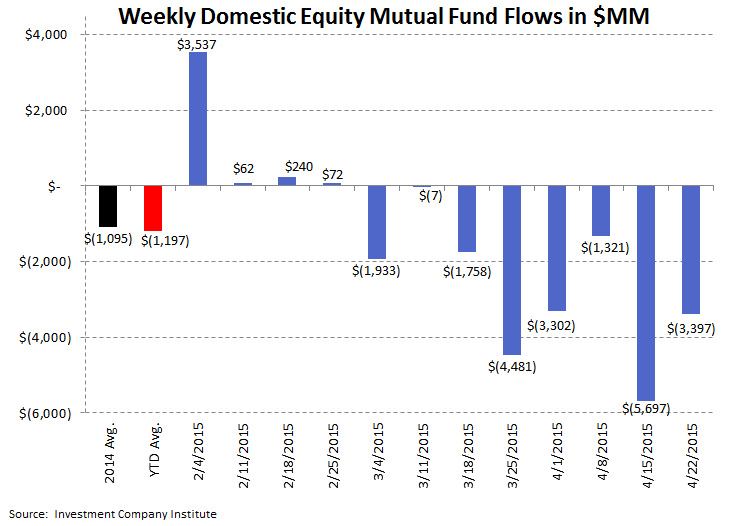
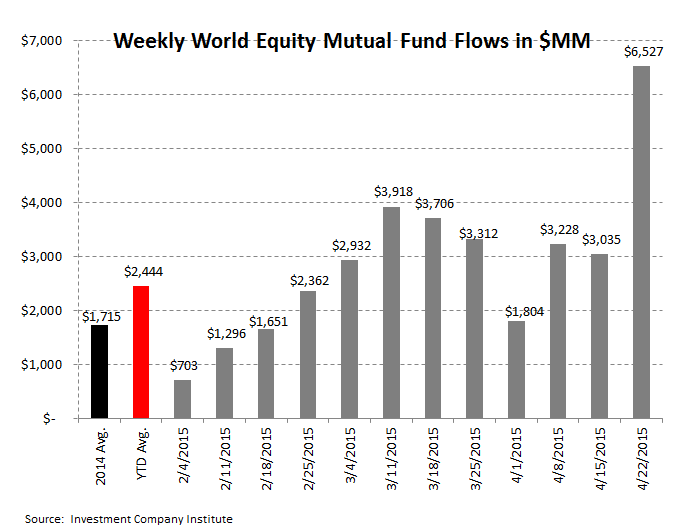
The exodus from active domestic equity managers shows no sign of abating. In the past 2 weeks, the active domestic equity category experienced its biggest net withdrawal of 2015 (of -$5.7 billion last week), which has been followed by another substantial withdrawal in the most recent week (in the 5 days ending April 22nd) of -$3.4 billion. The first 16 weeks of 2015 have now tallied -$19.1 billion in redemptions in the active domestic equity category compared to +$20.0 billion in the first 4 months of 2014. We remain cautious on the active equity manager space and maintain our short/avoid recommendation on Janus Capital and T Rowe Price. Conversely, investors have used at least a portion of their domestic equity redemptions to make contributions to international equity funds, which had their largest inflow in 119 weeks of +$6.5 billion this week.

In the most recent 5-day period ending April 22nd, total equity mutual funds put up net inflows of +$3.1 billion, outpacing the year-to-date weekly average inflow of +$1.2 billion and the 2014 average inflow of +$620 million. The inflow was composed of international stock fund contributions of +$6.5 billion and domestic stock fund withdrawals of -$3.4 billion. International equity funds have had positive flows in 48 of the last 52 weeks while domestic equity funds have had only 10 weeks of positive flows over the same time period.
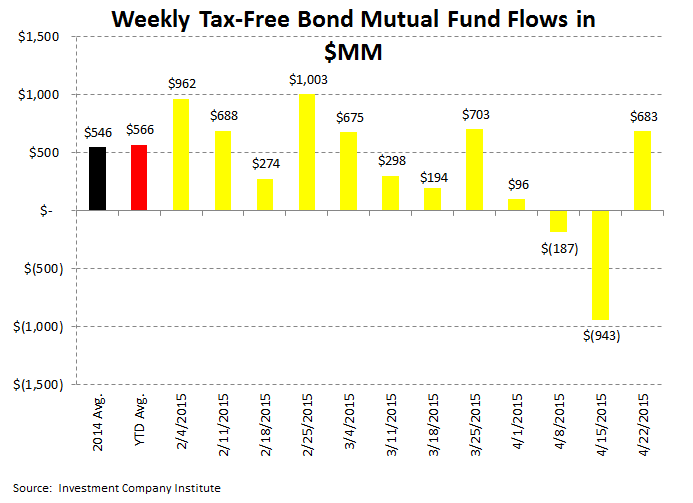
Fixed income mutual funds put up net inflows of +$3.8 billion, outpacing the year-to-date weekly average inflow of +$2.3 billion and the 2014 average inflow of +$929 million. The inflow was composed of tax-free or municipal bond funds contributions of +$683 million and taxable bond funds contributions of +$3.1 billion.
Equity ETFs had net subscriptions of +$3.2 billion, outpacing the year-to-date weekly average inflow of +$1.8 billion and matching the 2014 average inflow of +$3.2 billion. Fixed income ETFs had net inflows of +$2.2 billion, outpacing the year-to-date weekly average inflow of +$1.6 billion and the 2014 average inflow of +$1.0 billion.
Mutual fund flow data is collected weekly from the Investment Company Institute (ICI) and represents a survey of 95% of the investment management industry's mutual fund assets. Mutual fund data largely reflects the actions of retail investors. Exchange traded fund (ETF) information is extracted from Bloomberg and is matched to the same weekly reporting schedule as the ICI mutual fund data. According to industry leader Blackrock (BLK), U.S. ETF participation is 60% institutional investors and 40% retail investors.
Most Recent 12 Week Flow in Millions by Mutual Fund Product: Chart data is the most recent 12 weeks from the ICI mutual fund survey and includes the weekly average for 2014 and the weekly year-to-date average for 2015:


Most Recent 12 Week Flow Within Equity and Fixed Income Exchange Traded Funds: Chart data is the most recent 12 weeks from Bloomberg's ETF database (matched to the Wednesday to Wednesday reporting format of the ICI), the weekly average for 2014, and the weekly year-to-date average for 2015. In the third table are the results of the weekly flows into and out of the major market and sector SPDRs:


Sector and Asset Class Weekly ETF and Year-to-Date Results: In sector SPDR callouts, investors withdrew -$714 million or -4% from the XLF Financials ETF. Conversely, investors contributed +$662 million or +5% to the XLE Energy ETF on expectations for an energy price rebound.

Net Results:
The net of total equity mutual fund and ETF flows against total bond mutual fund and ETF flows totaled a positive +$290 million spread for the week (+$6.3 billion of total equity inflow net of the +$6.0 billion inflow to fixed income; positive numbers imply greater money flow to stocks; negative numbers imply greater money flow to bonds). The 52-week moving average is +$1.1 billion (more positive money flow to equities) with a 52-week high of +$27.9 billion (more positive money flow to equities) and a 52-week low of -$15.5 billion (negative numbers imply more positive money flow to bonds for the week.)

Exposures: The weekly data herein is important for the public asset managers with trends in mutual funds and ETFs impacting the companies with the following estimated revenue impact:

Jonathan Casteleyn, CFA, CMT
203-562-6500
Joshua Steiner, CFA
203-562-6500
