Editor's Note: This is a brief excerpt and chart from today's Morning Newsletter written by Hedgeye CEO Keith McCullough. If you'd like to stay a couple steps ahead of consensus, we courage you to subscribe.
If you can take a punch (both in this game and the one I used to play on the ice), your career will last longer. Here’s what the body blows have looked like on rallies (in Long Bond Yield terms) for the last 6 months:
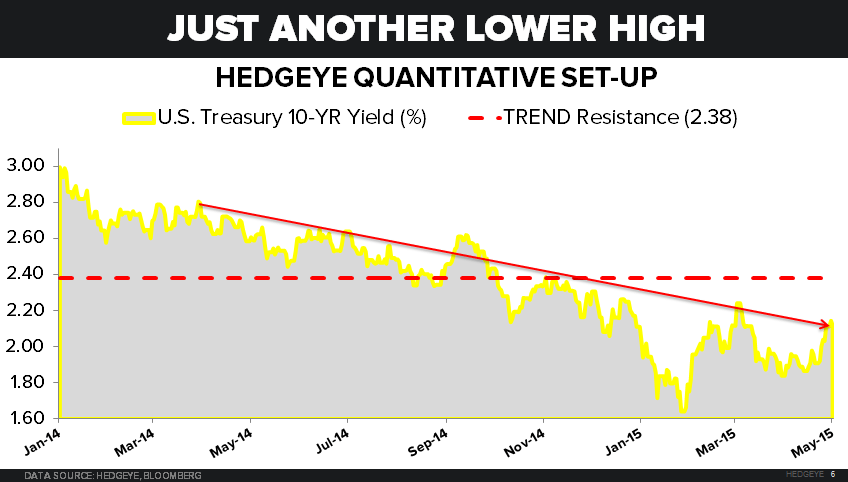
- December 2014, US 10yr Treasury Yield rallies to 2.28% on expectations of accelerating Q1 US growth
- March 2015, UST 10yr Yield rallies to 2.25% post another #LateCycle US Jobs report
- May 2015, UST 10yr Yield rallies to 2.14% on…
...Yep. I’ll take the bi-monthly black eyes for staying long Treasuries (TLT). For the next 3-6 months we think year-over-year US growth continues to slow. Staying with the process isn’t always easy. But we’ve got to be tough.
