Editor's Note: This is a brief excerpt and chart from today's Morning Newsletter which was written by Hedgeye U.S. Macro Analyst Christian Drake. (You could read the whole thing and be staying a step ahead of consensus if you subscribe.)
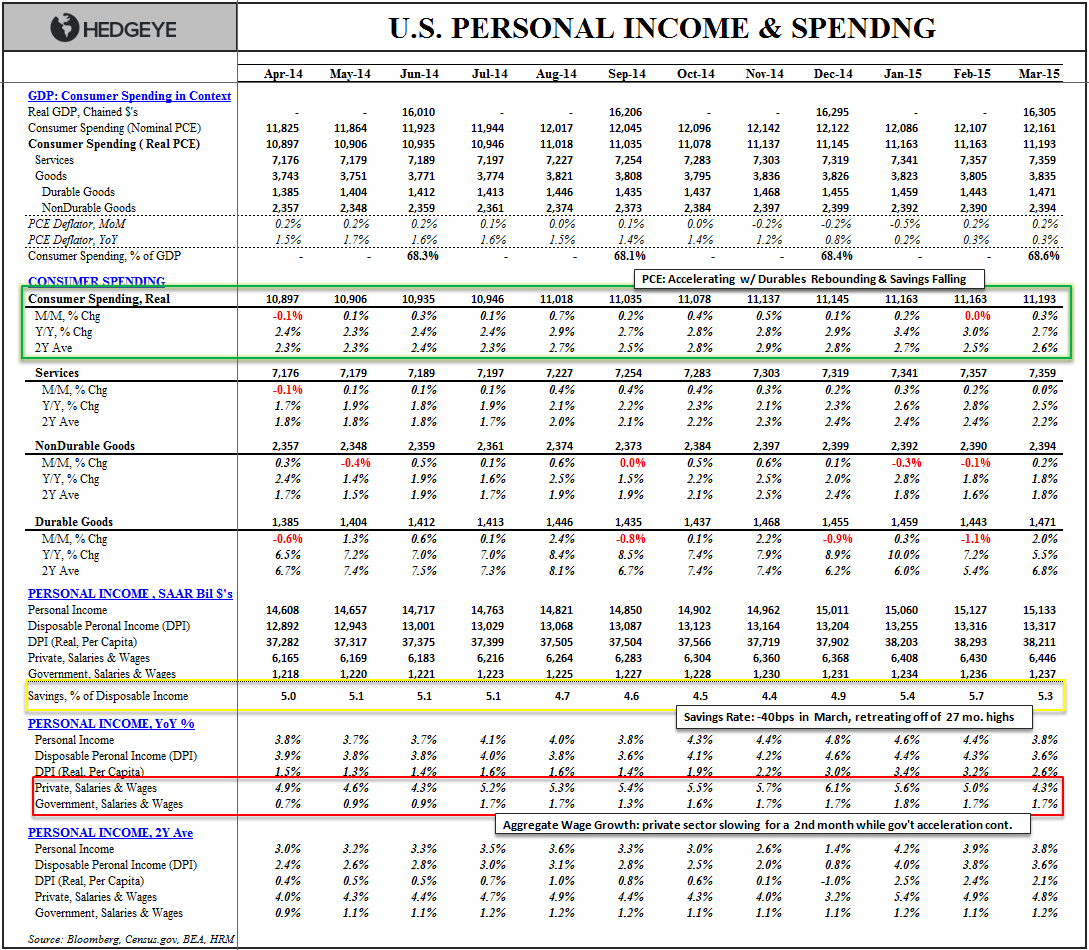
In the Chart of the Day, we annotate the latest household Income and Spending numbers for March released yesterday.
Generally, our Macro-for-Dummies/Lazy’s color-coding protocol follows a green = good, red = bad convention. Over the last couple quarters, however, I’ve struggled with what colors to use to characterize the existent income and spending dynamics