
Summary: 1Q GDP was expectedly soft at just +0.2% QoQ while accelerating to +3.0% on a year-over-year basis given the easy comp dynamics. Consumption growth was a relative positive although the large rise in the savings rate drove the weakest print in household spending growth in a year. Energy related Investment got cut in half and the confluence of strong dollar, flagging export demand, and relative domestic economic strength drove a widening trade gap and a -1.25% contribution to growth from net exports. Expect the Fed to acknowledge the softening but maintain policy flexibility by highlighting residual seasonality, externalities and firming inflation expectations.

The Data: C + I + G + NX
- C: +1.9% QoQ and contributing +1.31 = strongest part of report but also weakest in a year with goods consumption flagging alongside the largest sequential increase in the savings rate since (the fiscal cliff impacted) 2012.
- I: +2.0% QoQ and contributing +0.34 = Residential fixed investment softened in conjunction with the severe weather in 1Q while Non-Residential investment declined -3.4% QoQ alongside a halving in energy related investment and ongoing reticence by corporate management to accelerate capex into decelerating global growth, past peak margins and percolating labor cost inflation. Inventory accumulation was a sizeable support to total investment spending, contributing +0.7 to headline
- G: -0.8% QoQ and contributing -0.15 on the quarter.
- NX: Contributing -1.25 with exports -7.2% QoQ and Imports +1.8% = strong dollar/slumping export demand/relative economic strength driving a widening trade gap = lowest exports contribution in a year
Savings Rate: Income ↑, Savings ↑, Spending ↓: Savings Rate ticked up to +5.5% in 1Q15 vs. +4.6% in 4Q14. Aggregate incomes continue to increase but the rising savings rates continues to mute the translation to realized household spending growth.
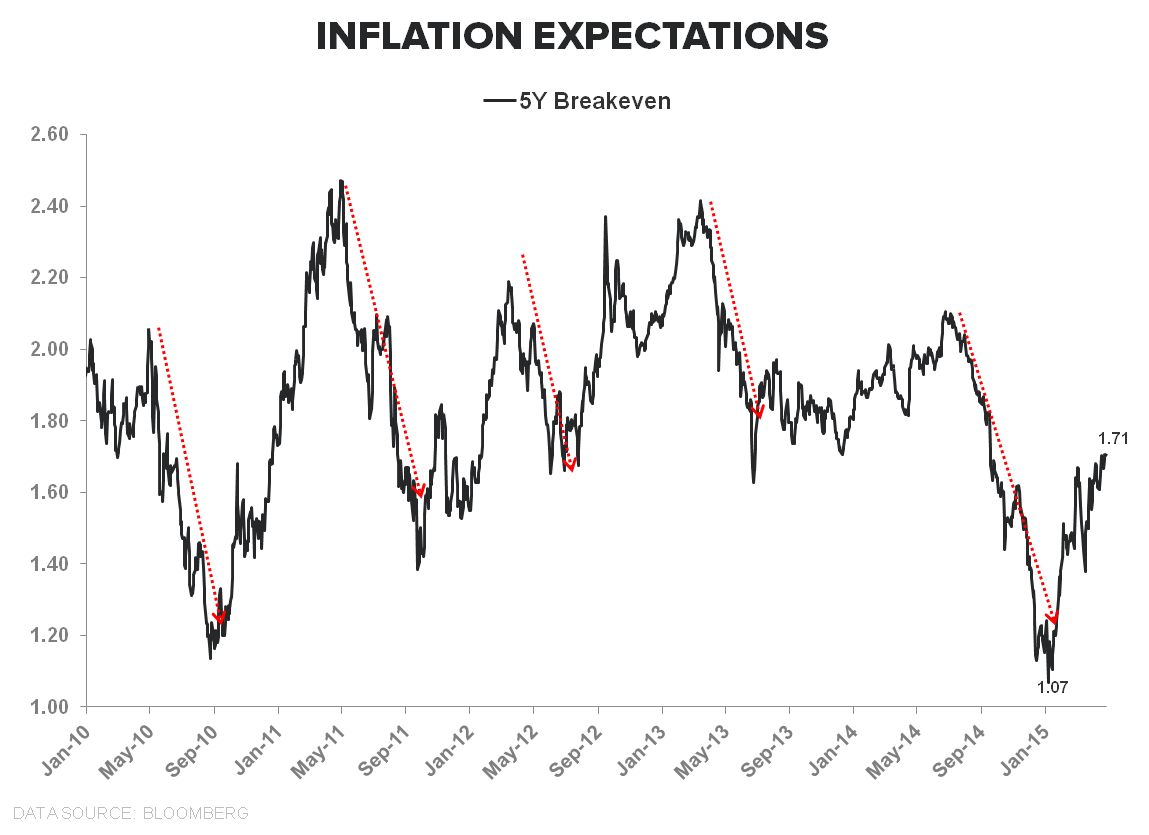
Inflation: Price softening modestly sequentially but core prices are stabilizing and Fed will looks towards the firming data/outlook
Real Final Sales (GDP less Inventory Change), Gross Domestic Purchases (GDP less exports, including imports), Real Final Sales to Domestic Purchasers (GDP less exports less inventory change) = all decelerating sequentially

POLICY: The net of domestic 1Q Macro data = lower for longer – something the market has been pricing in as we traversed the quarter.
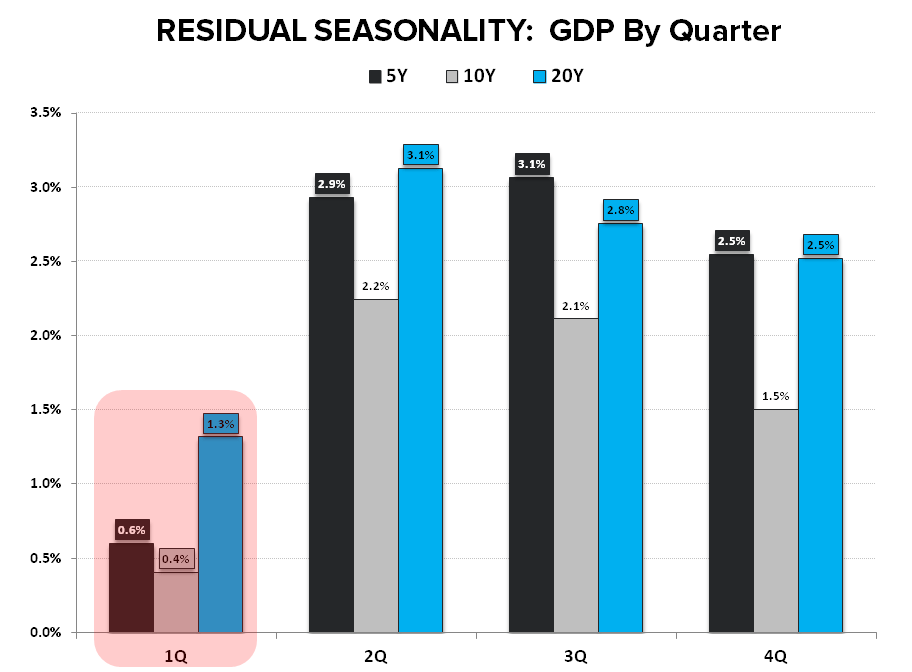
The Fed will moderate its assessment of economic conditions/momentum but will refrain from translating that into an explicit policy conclusion. A host of factors are rhetorically supportive of the Fed’s “transient” view of 1Q weakness including residual seasonality, firming inflation expectations, resumption of west coast port activity, a retreat in the dollar’s ascent and probable sequential improvement in the April employment report.
Residual seasonality in 1Q has been the new normal (ave GDP by Quarter chart below), breakevens have rallied, Core CPI/PCE/Billion prices project have stabilized, the weather drag has reversed (as evidenced in the March/April housing data) and each instance of marked sequential deceleration in net monthly employment gains over the last five years has been followed by a strong rebound in net hiring.
In short, the sequential deceleration in the 1st quarter was real but its magnitude was likely overstated and the Fed has enough fodder to keep its prospective policy path largely unchanged as its data dependency engine trolls for disconfirming/confirming 2Q data.


Christian B. Drake
@HedgeyeUSA
