This note was originally published at 8am on March 30, 2015 for Hedgeye subscribers.
“Individual persons tend to act pretty randomly.”
-Peter Zeihan
“But put those individual persons into large groups and individual randomness gives way to group patterns.”
-The Accidental Superpower, pg 92
Zeihan was alluding to one of the most important research topics @Hedgeye right now (demographics), but it can very well be applied to intermediate-term TRENDs in Global Macro positioning.
Eventually, most have to chase. And until everyone has given up on inflation expectations, I think the chase for #StrongDollar Deflation performance remains very much #on.
Back to the Global Macro Grind…
I do both bottom-up and top-down investing. And while some of their respective rate-of-change analytics are the same, how I consider “valuation” in each discipline is not.
In Global Macro, funds flow to and from specific exposures and styles; whereas in value-investing, for example, you can buy something that’s “cheap”, and get paid – provided there is a catalyst. In macro, “cheap” tends to get cheaper – and “expensive” tends to stay expensive, until a phase transition finds a causal factor to arrest it.
In the case of what was our Top Global Macro Theme for Q1 of 2015, Global #Deflation, the causal (and correlating) factor is the US Dollar. Get the TREND in the US Dollar right, and you’re going to get a lot of other things right.
Last week, the US Dollar had what we call a counter-TREND move, closing down for the 2nd straight week. Down Dollar weeks provide us both buying (stocks) and selling (commodities) opportunities – here’s what a -0.6% wk-over-wk decline in the US Dollar Index delivered:
- Burning Euros bounced +0.6% to -10.0% YTD vs. USD
- Commodities (CRB Index) bounced +0.5% to -6.4% YTD
- Oil (WTI) bounced +4.9% to -11.1% YTD
- Gold bounced +1.3% to +1.3% YTD
- Copper bounced +0.2% to -2.0% YTD
That’s a lot of bouncing! Notwithstanding that I was long 0% of those 5 things, I am quite pleased that I didn’t chase any of them either. Come Friday afternoon, most of these counter-TREND bounces failed @Hedgeye immediate-term resistance.
In Global Equities last week, Down Dollar didn’t get either the #BigBeta chasers (Biotech and Technology) or #YieldChasers (Utilities and REITS) bulls paid. For one of the few weeks of the year, it didn’t get European Equity bulls paid either – Emerging Market equities were weak as well:
- SP500 lost -2.2% on the week taking it to +0.1% YTD
- EuroStoxx600 corrected -2.1% wk-over-wk to +15.5% YTD
- Emerging Markets LATAM dropped another -2.3% to -11.8% YTD
In other words, if you chased the counter-TREND move in Oil mid-week, by the weekend you were getting spanked, in Brazilian stock market terms, as the Bovespa reversed sharply, closing down -3.6% on the week at +0.2% YTD.
But why does CNBC’s beloved SP500 look as anemic as a major equity market index that is tied to commodities (like Brazil). Oh, right – they’ve morphed the SP500’s earnings into an international basket that is very much infected by #StrongDollar too. That sucks.
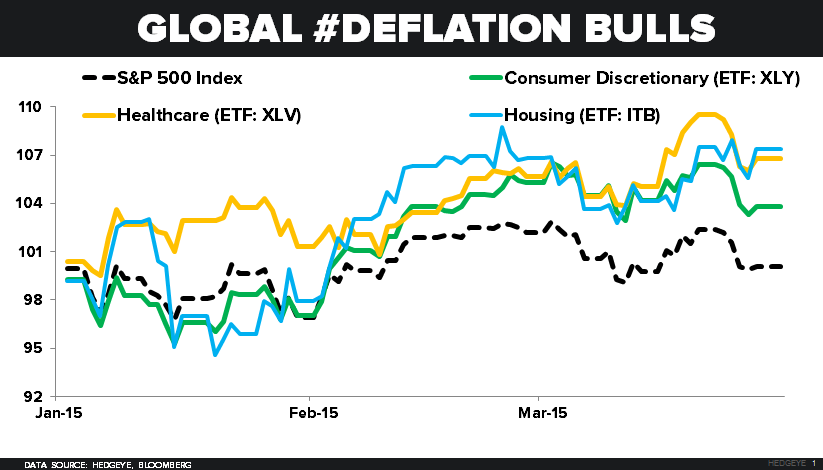
This is why, instead of owning the SP500, Global #Deflation Bulls have appropriately re-allocated their US equity exposure to US domestic revenue and earnings expectations:
- US Housing Stocks (ITB) were +0.1% in a down tape to +7.3% YTD
- US Consumer (XLY) and Healthcare (XLV) stocks continue to beat the SP500 at +3.8% and +6.8% YTD, respectively
- Russell 2000 and Nasdaq are +3.0-3.3% for 2015, beating their International Earnings Index competition too
If I didn’t signal “BUY” in what I signaled on red last week (and I had to chase the green US Equity futures this morning), I’d definitely buy more of the aforementioned basket over the SP500. It’s much more appropriately positioned for #Deflation.
The last point I wanted to make this morning has to do with Consensus Macro Sentiment. Going back to the weekend wood chopping, here’s how Wall Street’s (non-Commercial CFTC Futures & Options) net positioning looks going into quarter-end:
- SP500 (Index + Emini) net SHORT position came in by 41,359 contracts last week to -35,152
- Russell 2000 net SHORT position came in by 12,952 contracts last week to -13,277
- US Treasury 10yr Bond net SHORT position ROSE by 23,083 contracts last wk to -155,983
So you’ll probably get paid on hedge fund guys getting squeezed in both SP500 and Russell 2000 today anyway. We call this a good ole fashioned group pattern of a month-end markup!
Our immediate-term Global Macro Risk Ranges are now:
UST 10yr Yield 1.84-2.01%
SPX 2043-2080
RUT 1224-1250
DAX 11708-12153
USD 96.35-100.02
EUR/USD 1.05-1.09
Oil (WTI) 42.82-51.40
Gold 1150-1208
Best of luck out there this week,
KM
Keith R. McCullough
Chief Executive Officer