
Oil clearly likes a weaker dollar which has helped support prices over the last month. The USD is near flat with WTI gaining ~6% over the same period. We outlined the importance of this relationship (and all commodities for that matter) in our Q2 2015 Themes Call yesterday. This will continue to be our biggest indicator for the forward-looking direction of commodities prices.
- We shorted oil (via ETF OIL) yesterday into the close on the overbought signal and booked a quick gain on the open this morning, covering for a +2.2% gain short-side.
- Record production from the Saudis in March (10.3MM B/D) suggests they’ll keep the foot on the gas pedal moving forward. We will continue to trade oil with a bearish bias in real-time alerts.
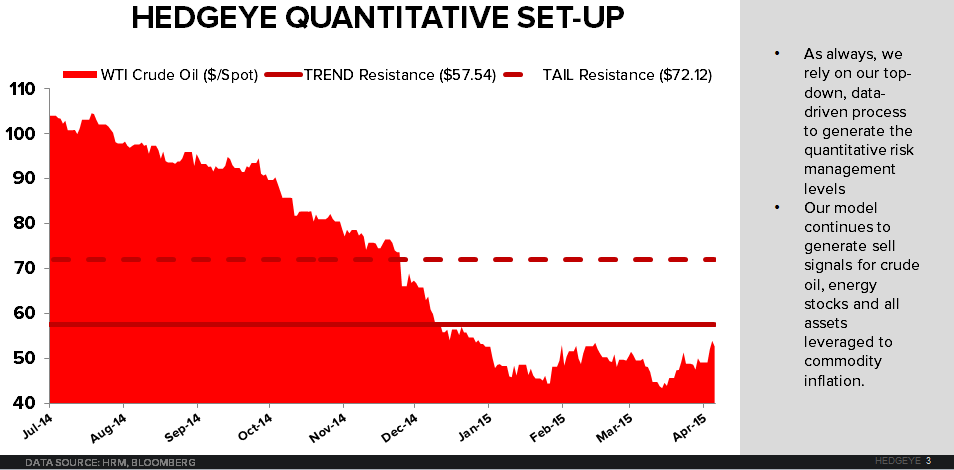
- The TREND Line of resistance up at $57 would have to be tested and breached for us to rework our view:
On the supply side, relative slowdowns in domestic production, declining crude imports from OPEC, and a continuation in inventory build suggests that the demand side of the equation is weak at best.
After the API reported a +12.2MM Barrel increase yesterday evening, the DOE reported the 13th consecutive week of aggregate inventory build (+10.9MM barrels). Cushing inventories increased for the 18th consecutive week (+1.2MM barrels).


On the domestic production front, an absolute top is materializing...
However, most importantly with respect to our process, top-down macro (futures prices) will continue to lead. Supply/demand adjustments happen on a significant lag (Is there a hypothetical price floor of any relevance to day-to-day changes in futures prices? No.)

Of the major plays, sequential production increases are expected to turn delta negative in Bakken, Eagle Ford, and Niobrara in April.
Collectively, these 3 regions account for over 60% of domestic production:
April EIA projections (m/m% change):
- Eagle Ford: -58bps
- Bakken: -64bps
- Niobrara: -1.3%
Reported production levels for March indicate a marginal m/m increase in the major crude producing regions (left column of first chart).
The second column in that first chart indicates that operating rigs are continuing to ramp on increasing output. Production per rig is accelerating m/m with rig count cut in half since the end of October.
The second chart is production weighted rate of change (m/m% change * [production as a % aggregate production from major plays]). On a 3 and 6-month basis, we’re still +5% and 10% respectively.


The absolute production slowdown is a meaningful transition for the forming of price support from a fundamental perspective, but as always the daily macro moves will continue to generate the risk management signals directing our tactical asset allocation and positioning.
Ben Ryan
Analyst
