As I stated last week in my 3Q09 earnings preview (please see October 15 post titled “MCD – The Hamburglar Strikes” for more details), reported September sales trends should be the primary driver of the company's stock price performance. That being said, I wanted to provide comparable sales ranges for each geographic segment as a benchmark of what I think would be GOOD, NEUTRAL, or BAD results based on 2-year average trends.
For reference, I think September same-store sales growth could come in below expectations with the U.S. posting a +1% number (really BAD), which would point to continued deceleration in 2-year average monthly trends. I am expecting September 2-year average trends in both Europe and APMEA to remain about even with August (NEUTRAL), which implies about 10% and 3.5% growth on a 1-year basis, respectively.
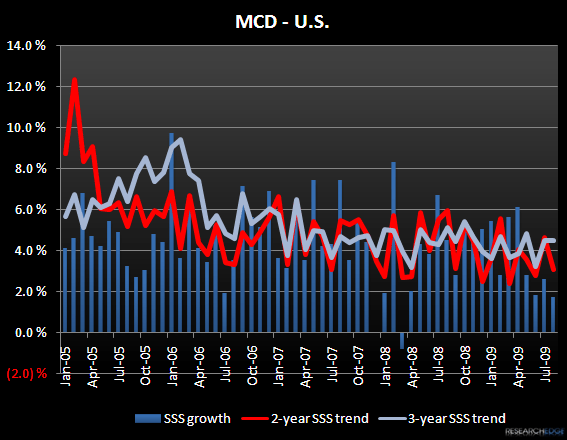
U.S. (facing an easy +2.8% comparison from last year):
GOOD: +3.3% or better would signal that the company is maintaining or improving its 2-year average trends on a sequential basis from August. Although investors were not happy with the August number (stock traded down 2% that day), I don’t think people are expecting any improvement in September.
NEUTRAL: +2% to +3.2% would point to a slight deceleration in 2-year average trends but would not represent another month of significant deceleration like we saw in August when 2-year average trends declined 160 bps from the month prior.
BAD: below +2% would highlight a continued fall off in 2-year average trends in the U.S. A reported 1% or worse would be really BAD as investors may have gotten over the shock of seeing these reported U.S. numbers in the 1.5%-1.8% range like we saw in June and August, but the company has not reported a number below +1.7% since March 2008 when comparable sales declined 0.8%. A +1% number would imply a 120 bp sequential decline in 2-year average trends.
Europe (facing a relatively easy +5.0% comparison from last year):
GOOD: +11% or better would signal an acceleration in 2-year average trends.
NEUTRAL: +9% to +11% would point to 2-year average trends that are about even with what we saw in July and August.
BAD: below +9% would imply a slight slowdown in 2-year average trends and anything below 6% would be viewed as really BAD as it would signal a return in 2-year average trends to the low reported June levels.

APMEA (facing a relatively easy +5.9% comparison from last year):
GOOD: +5% or better would signal an acceleration in 2-year average trends. A +8% or better would be really GOOD as it would imply a return to the 7%-plus 2-year average trend we saw earlier in the year.
NEUTRAL: +3% to +5% would point to 2-year average trends that are consistent with what we have seen in the last 3 months.
BAD: below +3% would imply that 2-year average trends have slowed from recent levels and would represent a deceleration from June when the company posted its lowest 2-year average result since January 2007.
