This note was originally published at 8am on March 03, 2015 for Hedgeye subscribers.
“You shape your houses and then your house shape you.”
-Winston Churchill
William Thorndike introduces Warren Buffett in chapter 8 of The Outsiders (pg167) as “The Investor CEO.” He uses the aforementioned (and ironic) Churchill quote then cites Berkshire’s sculptor himself: “being a CEO made me a better investor, and vice versa.”
Although I’ve only been a CEO for 7 years (and, at 40 years old, I’m a very young one at that!), I definitely agree. Running a company is a lot different than generating a hedge fund P&L. Both experiences have taught me invaluable lessons about life and investing.
While Buffett’s former #1 Rule in Investing was “don’t lose money”, he doesn’t really say that anymore when promoting his positions and politics on CNBC. To be clear though, Buffett became Buffett by selling high and buying low.
“By 1987, in advance of the October market crash, Buffett had sold all of the stocks in his portfolios, except for his 3 core positions. After his Capital Cities transaction, he did not make another public market investment until 1989” (pg175), when he bought Coke (KO).
The house that shapes Buffett’s commentary today is not the See’s Candies he bought in 1972 for $25 million. Buffett, due largely to his brilliant performance and compounded returns, is now the stock market. His #1 Rule now is to protect that house.

Back to the Global Macro Grind…
I’m calling that out as there’s plenty of video circulating on CNBC’s backslapping network this morning, replaying a fawning Becky Quick with Mr. Chuckles. If you were able to play the mainstream media to your advantage like this, you’d be chuckling too!
Here’s my 1 minute video on the matter: https://www.youtube.com/watch?v=60zMHvjybZI
Another reason to callout the chart-chasing buy-high-and-hope-to-sell-higher strategy (commonly called momentum and/or performance chasing) is that the US stock market closed at its all-time high of 2117 (+2.8% YTD) yesterday.
All-time, as I like to remind time-series fans, is a long time. And you generally don’t want to have the all-time high as your invested cost basis. You can ask some of the private equity firms who bought upstream and/or MLP Energy assets with a $105-120 price deck about that.
While it might be nice to avoid Buffett’s advice about having no shorts on “when the tide rolls” out, I did have 3 of them on in Real-Time Alerts yesterday, so it’s worth calling all 3 of them out as things that didn’t work for me, in that product, yesterday:
- Copper (JJC)
- J P Morgan (JPM)
- Foot Locker (FL)
Yep, while all 3 of these securities have sucked in 2015 YTD (i.e. they have negative returns), I guess I was the one who sucked having them on the short side yesterday. If you’re not sucking sometimes, you don’t have mirrors in your house either.
To review why I kept these “SELL” ideas on versus others:
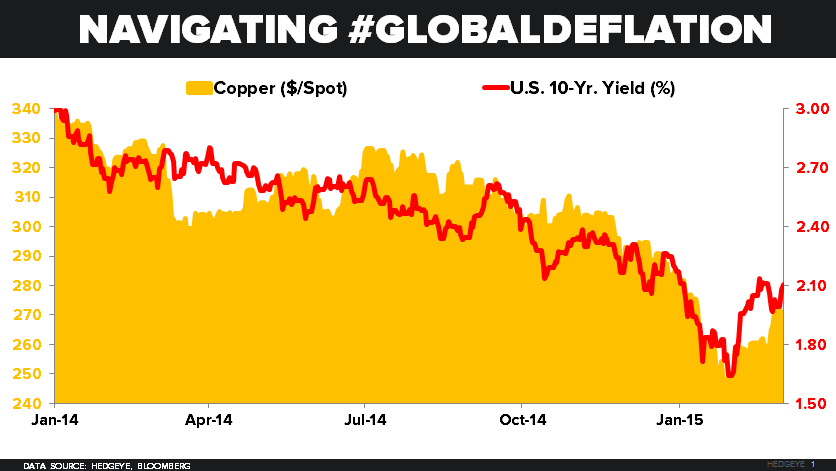
- Copper – down -1.6% this a.m. (-6.4% YTD) remains one of the most obvious ways to play our top theme, Global #Deflation
- JPM – down -1.3% YTD is in 1 of the 2 US Equity Sector Styles I like the least (Financials – sector ETF -0.8% YTD in an up tape)
- FL – down 2 cents YTD is on our Best Ideas SELL list (Brian McGough is the analyst, ask our team for his deck for details)
The other thing that went wrong for me yesterday was another one of these counter-TREND moves in US (and global) interest rates. While many might quibble with the simple calculation of +10% move in German Bund and Japanese Government Bond Yields (when you devalue to zero, that is the math), the move on the long-end of the US rates curve is where I seem to have the most lovers and loathers.
After dropping -12 basis points last week, the 10yr US Treasury Yield bounced +9 beeps (basis points) on the day yesterday. That brought back a whole host of tweeters who have been shorting the Long Bond via TLT for, well, the last 25% of the up move (since January of 2014).
One mainstream economic headline that hit the tape was the ISM slowing in FEB to 52.9 versus the initially reported 53.5 for JAN (which was then revised lower). So, other than it not being the worst monthly decline since OCT 2008 (like the PMI was on Friday), I don’t see any fundamental economic reason to be selling Long-duration, low-volatility, high return bonds.
That said, we need to risk manage the range, and here’s some time and space to consider:
- Immediate-term TRADE risk range for the 10yr Yield has widened to 1.84-2.16%
- Intermediate-term TREND resistance for the 10yr Yield = 2.39%
- US monthly Jobs Report is due out on Friday and that will definitely move the bond market
On a jobs miss, I think you test the low-end of that immediate-term risk range. On a jobs beat, I think you test the high end. The house that I built alongside my teammates @Hedgeye won’t make our call any more complicated than that.
Our immediate-term Global Macro Risk Ranges are now:
UST 10yr Yield 1.84-2.16%
SPX 2096-2122
VIX 12.80-16.39
USD 94.63-95.81
Oil (WTI) 48.04-52.23
Copper 2.55-2.73
Best of luck out there today,
KM
Keith R. McCullough
Chief Executive Officer