
The domestic production machine goes on for now, but a sequential deceleration in production growth is well underway.
The EIA released its monthly drilling productivity report Monday which showed more of the same. Production levels and efficiency continue to increase as storage capacity dwindles:
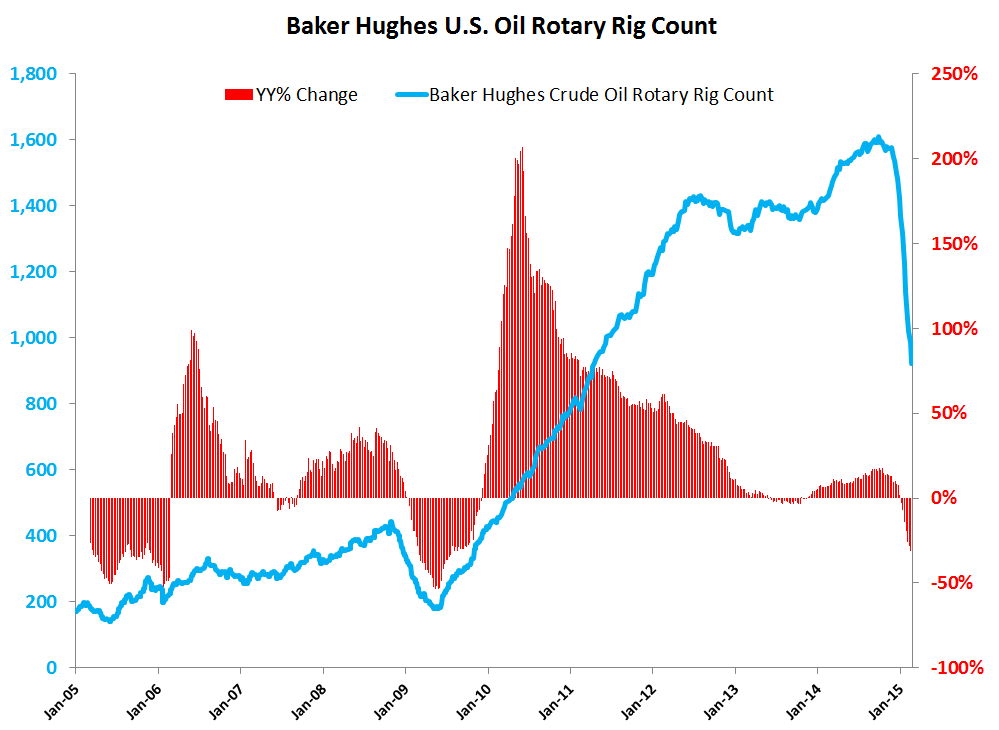
- Rigs continue to come offline at an ACCELERATING rate
- Production levels are still delta positive on both a m/m and y/y but DECELERATING
- Production per rig is also delta positive on a m/m and y/y basis but DECELERATING

In the recent past we have been producing approximately ~1MM B/D in excess of what we’re consuming domestically. And now the question becomes… When will this present a big problem? The case that an infrastructure lag will put a floor in prices is straightforward, but considering we’re only 2/3rds full in aggregate, there is plenty of pain between now and the point in time where the production surplus will be at a critical state.
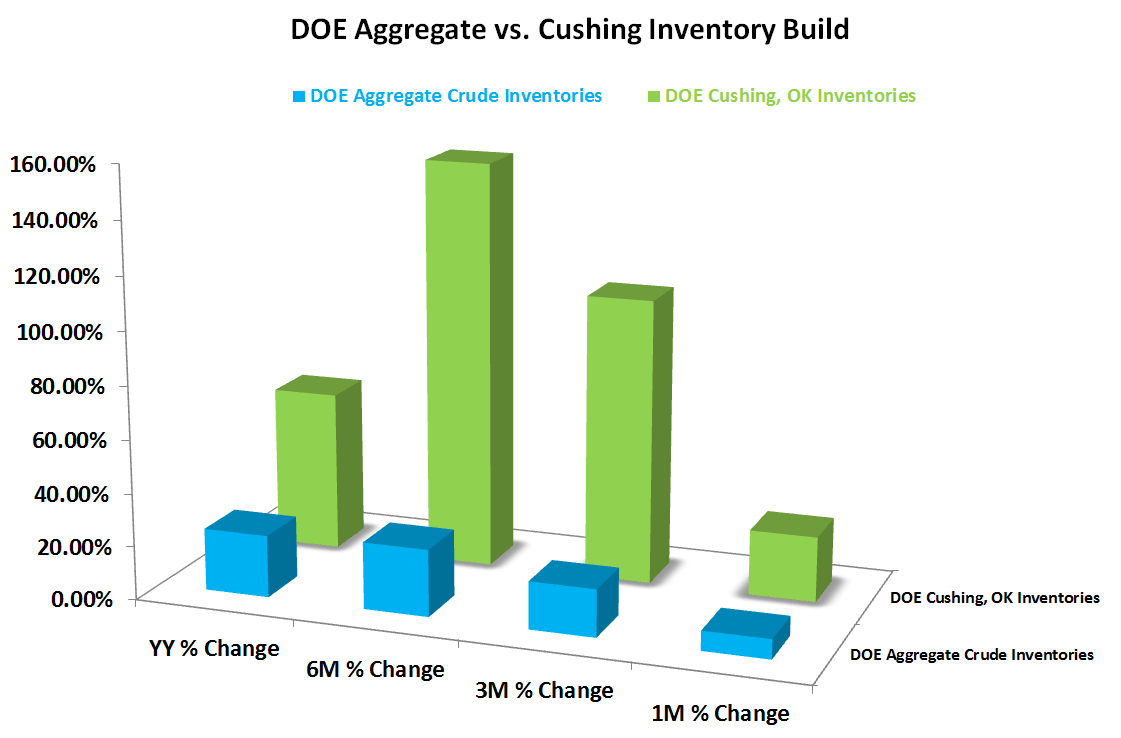
- For 9 consecutive weeks the EIA has reported an AGGREGATE crude oil inventory build to new all-time highs
- For 14 consecutive weeks, the country’s main trading hub in Cushing, OK has reported a positive inventory build
Cushing, OK remains a focal point because of the transportation constraints that excess crude flow could cause if pipelines are forced to be utilized in a storage capacity. Storage capacity at Cushing is also being filled much faster than the country’s storage availability in aggregate as it is a main crossroads for crude flows to the Gulf.
Inventories in Cushing remain well short of full capacity, and well short of levels reached as recently as 2013.
In January of 2013, Cushing had 51.675MM barrels of Oil in storage and only about 65MM barrels of capacity which translated to:
- January 2013: 80% capacity utilization (Spot WTI moved -12% peak to trough from January to April after capacity utilization peaked)
- March 2015: 66% capacity utilization (using the methodology outlined below)
Cushing inventories have only recently turned positive on a Y/Y rate-of-change basis and remain below 2013 levels (a point in time where storage capacity was much lower).


Should current trends continue, which we peg as unlikely, storage capacity in Cushing may be full by June. The EIA only reports storage capacity data semi-annually (September 30th and March 31st), so we have assumed the average increase in 6-Month storage capacity above since the shale revolution started.
WTI crude oil remains in a BEARISH FORMATION (TRADE, TREND, TAIL) with our intermediate-term TREND duration price deck in a range from $36.38-$58.02.
Please feel free to ping us with comments or questions.

Ben Ryan
Analyst
