
There is one thing we can be sure of with regards to long-term commodity prices over the long run:
They will continue to go up and down, falling just as far as they rose in real-terms, from cycle to cycle.
In the shorter run, which is where we all make our tactical investing returns, we think there are two key reasons commodity prices, especially in the raw material and metals space, could move lower from here:
1) The Hedgeye macro view is that the U.S. dollar, WHICH HAS ALWAYS LED THE BIG TURNS IN CYCLES ACROSS DURATIONS, looks like it will continue to strengthen over the intermediate to longer-term even if we briefly transition from QUAD 4 to QUAD 1 and back again; and
2) There is a cap-ex cycle in the commodities space which lasts longer than the normal business cycle on average, and we are now on the back-end of BOTH cycles.
The table below is separated into 6 periods of large inflections in dollar and inflation adjusted growth, spanning across 8 business cycles. In this period of time we’ve experienced 2 longer resources-related capital investment cycles (back-end of the 2nd currently):
1. 1970s inflation (Bretton Woods)
2. Early 1980s recession and contractionary policy
3. Mid-1980s-mid-1990s expansion
4. Clinton – tight policy, strong dollar deleveraging
5. Greenspan de-regulation, low interest rate era (post tech-bubble through 08’ and still currently a part of the commodities bubble)
6. Great recession-to-present (commodity prices down from 2010 bubble but still room to run)
There is a clear pattern that emerges, which seems to be very similar to our current cycle:
USD/Growth Inflection --> inflection in metals (early cycle materials) --> inflection in Ags. And Energy (consumer-based)


Clearly, as the dollar goes, so too goes the price of many key commodities. Not to view the dollar as the only factor to consider, but certainly getting the direction of the USD right will enable us to get the price direction of many of these commodities right.
The existence of “super-cycles” as some call it, are longer than business cycles because of the capital intensive nature of bringing product online.
We thought the following quote from Otaviano Canuto of the World Bank was a good description of the normal chain of events:
“Reports on previous cycles and price volatility have been more convergent. These works tend to agree on the localization of at least three super-cycles of commodities since the 19th century, as well as one initiated at the end of the 1990s. Typically 20-year boom periods have reflected strong demand associated with moments of rapid industrialisation and urbanisation – as in the case of the US in the 1890s, or China in the 2000s – in which supply takes a long while before matching that demand. When this happens, periods of much lower commodity prices follow.”
Now that iron ore capacity has matched that demand, we have observed the end result several years after the demand picture turns sour. In other resource-heavy areas, this downside is just beginning.
Simply put, the amount of time elapsed between making an investment decision (capital spent), bringing production online, and getting those top-line revenue streams often spans over multiple business cycles. Supply does in fact take longer to match the demand and investment decisions tend to be made at times when the spread between the cash cost of production and per/unit selling price are the widest (that NPV picture looks most attractive).
Look no further than this current cap-ex cycle. Investments that were made before the Great Recession are just now being finished:
Mid-cycle commodity bubble investment decisions --> Great Recession --> investment goes on through the next cycle to the 2010 bubble highs and beyond --> the over-investment is now unraveling in some areas, (iron ore and copper) with others to follow
The aftermath will bring more pain:
- How much further can the Fed lower interest rates to “fight deflation”? Rates are already near zero yet we are in a deflationary environment and the dollar is getting stronger (we believe it will get even stronger). Can the Fed out-Ease the BOJ and ECB? Nevermind lowering rates. The question consensus is asking is WHEN will a rate HIKE occur? Could a surprise "kicking-of-the-can" crush the dollar? Probably not for any more than a short-term correction.
- Projects that were implemented at the commodity bubble highs circa 2006-10 are still being brought online. Just look at the fertilizer space (which is a monopolized industry in some products)

Like iron ore and copper, fertilizer is a mature industry that pivots on a number of very accessible and very abundant resources, and the demand for fertilizer (both nitrogen, phosphate, and potash-based) has followed a slow and steady climb for a long period of time. Given this dynamic, the above table tells the picture of “supply coming late” to meet demand. However the question we would ask is:
Were low-interest policies inflating commodities prices circa Greenspan deregulation (selling vs. cash cost) or was there as long period of under-investment lagging a demand increase for some of the most abundant resources on earth?
There is quite a bit of evidence for the former...
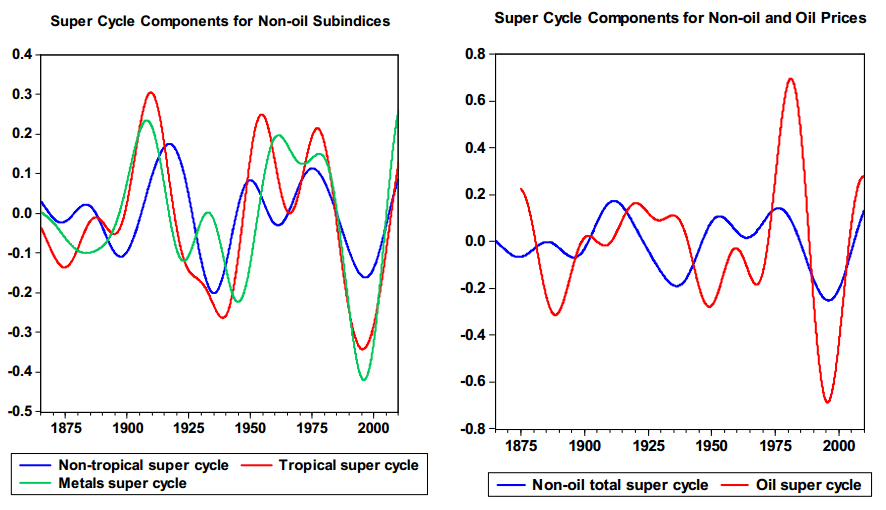
The charts re-purposed below, and sourced from the World Bank and OECD, also provide support for the existence of this longer-cycle with the previous two evidenced in the tables above.
Pulling back the magnifying glass gives a peek at where we are in the longer cycle. There are a few key takeaways we would like to point out:
1) Commodity prices go down over the long-term driven by a surplus of investment in inflationary periods (Oil is the only commodity that has appreciated in real-terms over the long-term)
2) Not surprisingly the metals (early-cycle materials specifically) segment tracks global GDP pretty closely


A risk management strategy molded by predicting how long the current cycles will last is not something we subscribe to, but we acknowledge that longer cap-ex cycles do exist in the industrials, materials, and mining space and they take longer to manifest than a business cycle.
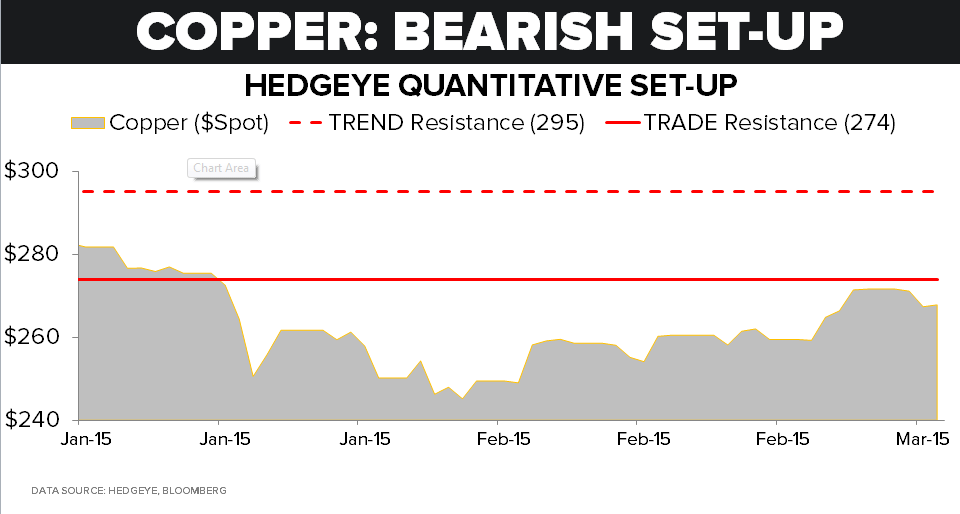
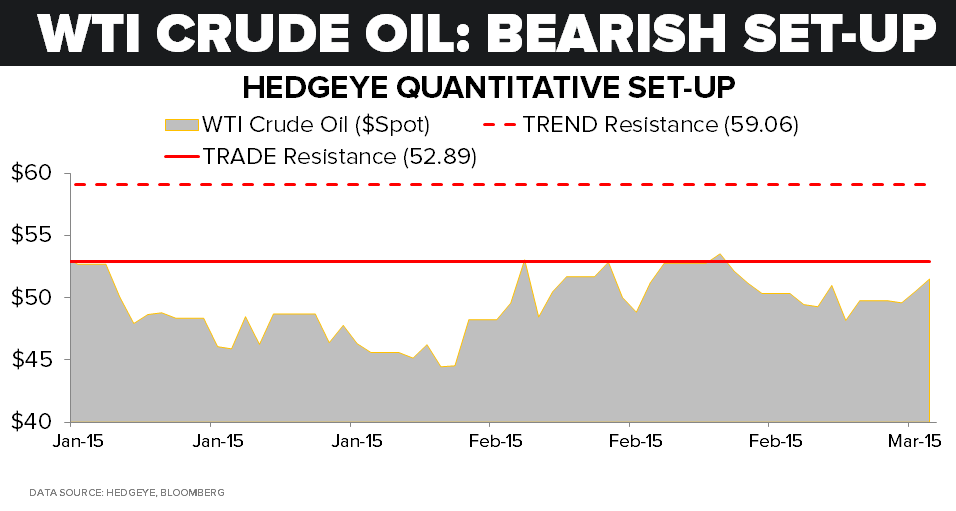
Considering we’re on the back-end of both of these longer-term cycles, we remain bearish on the space in a QUAD 4 set-up where both growth and inflation are decelerating. The fundamental matches our bearish quantitative view which is what we want to see for picking good shorts in the commodity and commodity related space.
We have been in and out of copper on the short-side over the last couple of weeks (ETF: JJC) in Real-Time Alerts and continue to expect downside in the commodities complex over the intermediate to longer-term.

Ben Ryan
Analyst
