This note was originally published February 19, 2015 at 07:14 in Financials. Click here for more information on how you can become a subscriber to Hedgeye.
Investment Company Institute Mutual Fund Data and ETF Money Flow:
Investors remained defensive in the most recent mutual fund and ETF money flow survey for the week ending February 11th. The sum of total equity mutual funds and ETFs against total bond mutual funds and ETFs, remained negative (-$2.1 billion) for the sixth straight week which has now totaled -$39.0 billion thus far this year (a $39 billion favoritism by investors for fixed income versus equities). For the equivalent first six weeks of 2014, investors had favored equities over fixed income by a +$31.3 billion spread, highlighting the very risk averse start to the New Year. In addition, investors built up cash positions last week, contributing +$4 billion to money market funds.
Focusing on domestic equity mutual fund flows, even with a quick 3 week positive subscription of +$7.8 billion for the prior 3 weeks, domestic equity mutual funds put up another loss of -$27 million this week and have now lost -$62.4 billion over the past 52 weeks (with outflows in 37 of 52 weeks). We continue to flag caution for the most directly affected managers in this group with our underweight or short views on T Rowe Price and Janus Capital (see our TROW and JNS research).

In the most recent 5 day period, ending February 11th, total equity mutual funds put up net inflows of +$1.3 billion according to the Investment Company Institute, lagging the year-to-date weekly average inflow of +$1.5 billion but outpacing the 2014 average inflow of +$620 million. The inflow was composed of international stock fund contributions of +$1.3 billion and domestic stock fund withdrawals of -$27 million. International equity funds have had positive flows in 48 of the last 52 weeks while domestic equity funds have had only 15 weeks of positive flows over the same time period.
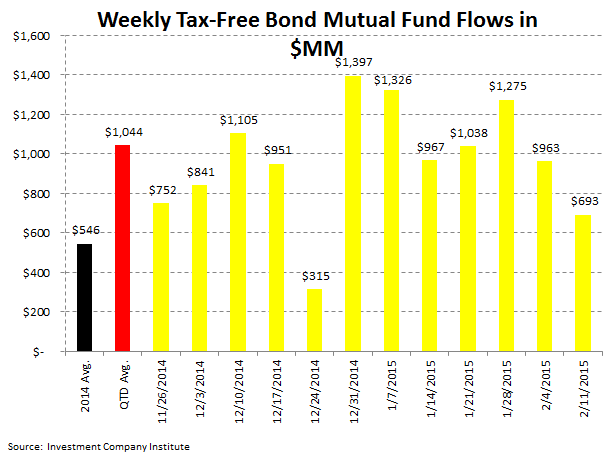
Fixed income mutual funds put up inflows of +$5.9 billion, outpacing their year-to-date weekly average inflow of +$2.7 billion and their 2014 average inflow of +$929 million. The inflow was composed of +$5.2 billion of contributions to taxable funds and +$693 million of contributions to tax-free or municipal bond funds. Munis have had a solid run with subscriptions in 51 of the last 52 weeks.
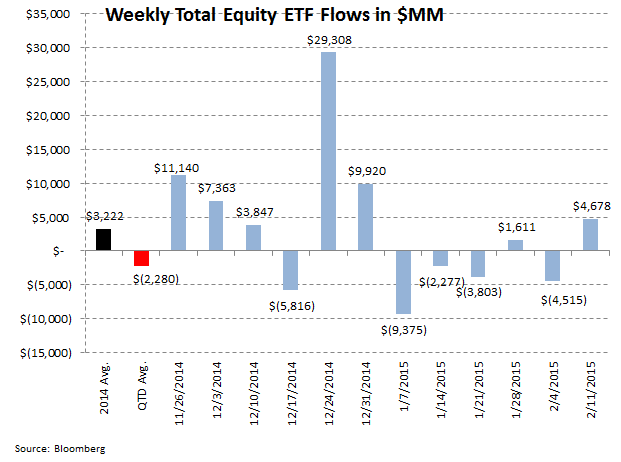
Equity ETFs gained +$4.7 billion in contributions, outpacing both the year-to-date weekly average outflow of -$2.3 billion and the 2014 weekly average inflow of +$3.2 billion. Fixed income ETFs took in +$2.2 billion, trailing the year-to-date weekly average inflow of +$3.0 billion but outpacing the 2014 weekly average inflow of +$1.0 billion.
Mutual fund flow data is collected weekly from the Investment Company Institute (ICI) and represents a survey of 95% of the investment management industry's mutual fund assets. Mutual fund data largely reflects the actions of retail investors. Exchange traded fund (ETF) information is extracted from Bloomberg and is matched to the same weekly reporting schedule as the ICI mutual fund data. According to industry leader Blackrock (BLK), U.S. ETF participation is 60% institutional investors and 40% retail investors.
Most Recent 12 Week Flow in Millions by Mutual Fund Product: Chart data is the most recent 12 weeks from the ICI mutual fund survey and includes the weekly average for 2014 and the weekly quarter-to-date average for 1Q 2015:


Most Recent 12 Week Flow Within Equity and Fixed Income Exchange Traded Funds: Chart data is the most recent 12 weeks from Bloomberg's ETF database (matched to the Wednesday to Wednesday reporting format of the ICI), the weekly average for 2014, and the weekly quarter-to-date average for 1Q 2015. In the third table are the results of the weekly flows into and out of the major market and sector SPDRs:

Sector and Asset Class Weekly ETF and Year-to-Date Results: In sector SPDR call-outs, energy XLE flows continue to track performance; the XLE returned -0.63% from 2/5 to 2/11 and lost -4% (-$570 million) in withdrawals over the same period. Separately, investors continue to make defensive sector allocations, contributing +4% (+$302 million) to the utilities exchange traded fund the XLU.

Net Results:
The net of total equity mutual fund and ETF flows against total bond mutual fund and ETF flows totaled a negative -$2.1 billion spread for the week (+$5.9 billion of total equity inflow outweighed by the +$8.1 billion inflow to fixed income; positive numbers imply greater money flow to stocks; negative numbers imply greater money flow to bonds). The 52 week moving average has been +$1.6 billion (more positive money flow to equities), with a 52 week high of +$27.9 billion (more positive money flow to equities) and a 52 week low of -$15.5 billion (negative numbers imply more positive money flow to bonds for the week).

Exposures: The weekly data herein is important for the public asset managers with trends in mutual funds and ETFs impacting the companies with the following estimated revenue impact:

Jonathan Casteleyn, CFA, CMT
203-562-6500
Joshua Steiner, CFA
203-562-6500