This note was originally published at 8am on February 05, 2015 for Hedgeye subscribers.
“60% of the time it works….everytime”
-Brian Fantana, Anchorman (Clip)
Over the 2001-Present period (n = 160 months), the sequential, directional change in Nonfarm payrolls is the same as that of the ADP Employment series 64% of the time.
The ADP report for January released yesterday showed the sequential change in net payroll adds declined by -40K to +213K from an upwardly revised December total of +253K.
The current Bloomberg estimate for January Nonfarm payrolls is +230K, down sequentially from the +252K reported in November. By the numbers, the sequential decline in net payroll gains reported by ADP suggests consensus is sitting on the right side of the 2:1 asymmetry into the print tomorrow.
What do you do with that?
Not much really - it’s more analytical anecdote than investible projection. Convictedly forecasting the NFP numbers on a month-to-month basis with precision is a quixotic endeavor. We can generally handicap the balance of risk as it relates to consensus expectations but we haven’t found a method for reliably forecasting a point estimate – so we don’t.
The current price/quant signals and our TREND view on domestic fundamentals generally drives our positioning into the number and we simply take what BLS gives us on jobs day and respond accordingly.
We Get What We Get…& Don't Get Upset

Alongside its inveterate interest in wage inflation, the prospect for shale state employment pressure to derail the labor market recovery – and the current expansion more broadly - sits as an acute and rising investor focus into the January Employment report.
We’ve discussed the energy economy and the developing macroeconomic impacts associated with the strong dollar driven commodity price cratering in scattershot over the last couple months but it’s worth compiling and recapitulating.
Starting broadly and narrowing:
Evolution of US Oil intensity: U.S. Oil intensity - oil consumption per unit of (real) GDP – has declined by some 56% over the last 3 decades. Summarily, as the economy has moved away from industrial production and towards ICT and Services production growth’s dependence on energy has declined. The implication is that while the energy renaissance and the concomitant growth (& potential over-investment) in related industry makes it particularly vulnerable to an acute price shock, the transmission/amplification of that shock through the broader economy should be more muted relative to prior instances of heightened oil-price volatility.
Oil Sector Employment: The BLS catalogues oil & gas related employment within four major subsectors: Oil and Gas Extraction, Oil & Gas Pipeline Construction, Support Activities for Oil & Gas Operation and Mining/Oil/Gas field Machinery.
- Share of Total: Collectively, BLS estimates these industries employed 780K people as of November 2014. Relative to Total Nonfarm employment of 140MM, those most directly employed in Oil and Gas extraction represent 0.6% of the NFP labor force.
- Growth From Trough: Relative to the NFP employment trough in February 2010, Oil and Gas related employment is up +274K – a remarkable 54%. This compares to growth of +8.1% for total NFP employment over the same period. Further, Oil related employment gains represent 2.6% of the total increase in employment since trough (274K of 10.4MM total increase in employment) – certainly an outsized contribution relative to its share of total employment.
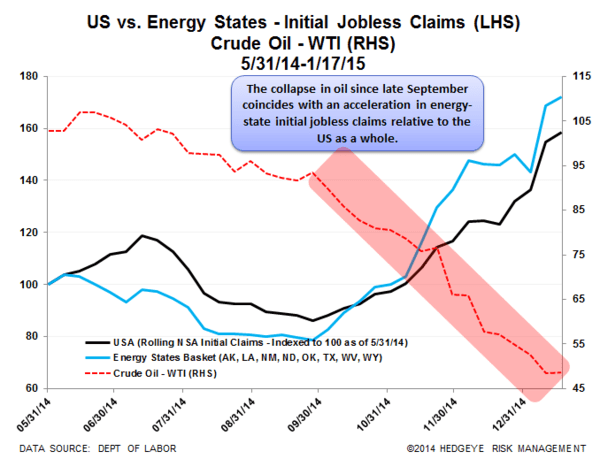
Energy State Employment: An alternate measure of the energy sectors impact on employment is to look at total employment gains in “energy” states relative to the rest of the country. Analyzing employment changes at the state level provides an indirect (albeit largely imprecise) measure of the multiplier effects stemming from relative strength in the energy economy. We have been using a basket of eight energy states (AK, LA, NM, ND, OK, TX, WV, WY) in analyzing the initial jobless claims data for negative divergences in recent months. We use the same basket here in analyzing state level employment changes
- Share of total: Collective Energy State employment is currently 12.9% of total. This is roughly in-line with the baskets share of the economy with collective energy state GDP at 13.2% of total as of 2013.
- Growth From Trough: Energy state employment has increased 1.998MM since the February 2010 employment trough with its share of total employment rising from 12.5% to 12.9% over the same period. In other words, by this ‘crude’ measure, energy states have accounted for a moderately outsized 18.7% of the total gain in employment.
Initial Claims: We’ve been monitoring the trend in initial jobless claims for the basket of 8 energy state highlighted above for negative divergences from the National Trend.
- Energy State Decoupling: We’ve indexed both the National and Energy State series back to May of last year and have monitored the spread between the two indices in the wake of the oil price collapse. As can be seen in the Chart of the Day below the spread between the two series has held at around 15 points the last couple weeks. In short, the accelerating decline in oil prices since late September has coincided with a moderate acceleration in energy state initial jobless claims relative to the US as a whole. We’ll get the incremental update this morning at 8:30am.
So, energy state labor market trends do appear to be deteriorating on the margin and (at least partially) corroborating anecdotes of energy companies reducing headcount and scaling back capex. At the same time, the U.S. is significantly less oil intensive than it once was, employment directly tied to oil and gas extraction is a relatively small fraction of the total, and there are the oft-highlighted consumption benefits of lower energy prices – although these are likely to play out on a decidedly different timeline than oil sector employment adjustments.
Practically, is a moderate retreat in energy employment clearly discernible above the seasonality and month-to-month noise in the monthly employment data? Perhaps, but it would have to be a large percentage change if those losses are, indeed, concentrated in the narrow set of BLS classified oil & gas extraction industries.
Remember also that the standard error on the NFP estimate is approximately +/- 90K at the 90% confidence interval. In other words, if we happen to get a print of +90K on Friday, that means the BLS is 90% sure we gained between 0 and 180K jobs.
Further, with USD correlations as strong as they are, a weak dollar move could augur sizeable, expedited upside for stuff priced in those dollars. According to the University of Michigan Consumer Sentiment report for January, American consumers aren’t convinced of the sustainability of the oil price retreat either. In fact, the prevailing expectation is that gas prices rise 20 cents over the next year and ~$1 over the next few.
#MeanReversion: 100% of the time it works….everytime.
Ultimately, the net impact of many of the oil price shock dynamics are equivocal and forecasting whether the collective impact will catalyze a negative, self-reinforcing inflection in the labor market is not one we’re comfortable making. However, with the data context above and our weekly tracking of the high frequency labor data, we do feel comfortable in our ability to monitor incremental changes and dynamically update our view.
Plus….there’s bits of real panther in our risk management model - so you know it’s good.
Our immediate-term Global Macro Risk Ranges are now:
UST 10yr Yield 1.65-1.87%
SPX 1987-2066
VIX 16.06-21.78
YEN 116.09-118.87
Oil (WTI) 42.24-51.97
Gold 1251-1301
Prepare. Perform. Prevail.
Christian B. Drake
U.S. Macro Analyst