Editor's note: This note was originally published February 12, 2015 at 11:19 in Financials. For more information on our services click here.
Investment Company Institute Mutual Fund Data and ETF Money Flow:
Fund flows continue to be defensive in 2015. Net money flow, the sum of total equity mutual funds and ETFs against total bond mutual funds and ETFs, has remained negative for all of 2015 as equity ETFs have been losing ground. Equity ETFs lost another -$4.5 billion in the 5 days ending February 4th, now totaling -$18.4 billion so far in 2015. On average, investors have contributed +$1.9 billion more to fixed income than equity in each week of 2015. Additionally, investors have pulled -$26.2 billion (-12%) from the SPY year to date, favoring the defensive GLD and TLT funds. GLD has taken in +$2.4 billion (+9%) with the 20 year Treasury ETF (TLT) taking in +$1.2 billion ( or +19%) in 2015.

In the most recent 5 day period ending February 4th, total equity mutual funds put up net inflows of +$4.2 billion according to the Investment Company Institute, outpacing the year-to-date weekly average inflow of +$1.5 billion and the 2014 average inflow of +$620 million. The inflow was composed of international stock fund contributions of +$704 million and domestic stock fund contributions of +$3.5 billion. Last week was the third consecutive week where domestic equity funds outpaced international stock funds, a counter trend from a major theme last year (where international funds substantially outpaced domestic). International equity funds have had positive flows in 48 of the last 52 weeks while domestic equity funds have had only 16 weeks of positive flows over the same time period.
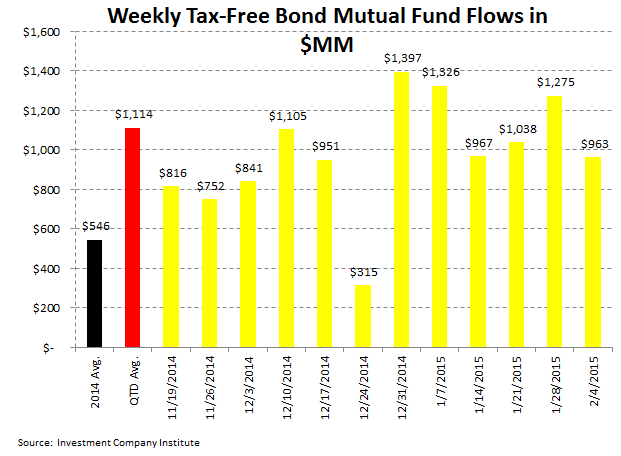
Fixed income mutual funds put up inflows of +$3.2 billion, outpacing their year-to-date weekly average inflow of +$2.1 billion and their 2014 average inflow of +$929 million. The inflow was composed of +$2.3 billion of contributions to taxable funds and +$963 million of contributions to tax-free or municipal bond funds. Munis have had a solid run with subscriptions in 51 of the last 52 weeks.
Equity ETFs lost -$4.5 billion via redemptions, trailing both the year-to-date weekly average outflow of -$3.7 billion and the 2014 weekly average inflow of +$3.2 billion. Fixed income ETFs took in +$9.7 billion, outpacing the year-to-date weekly average inflow of +$3.1 billion and outpacing the 2014 weekly average inflow of +$1.0 billion.
Mutual fund flow data is collected weekly from the Investment Company Institute (ICI) and represents a survey of 95% of the investment management industry's mutual fund assets. Mutual fund data largely reflects the actions of retail investors. Exchange traded fund (ETF) information is extracted from Bloomberg and is matched to the same weekly reporting schedule as the ICI mutual fund data. According to industry leader Blackrock (BLK), U.S. ETF participation is 60% institutional investors and 40% retail investors.
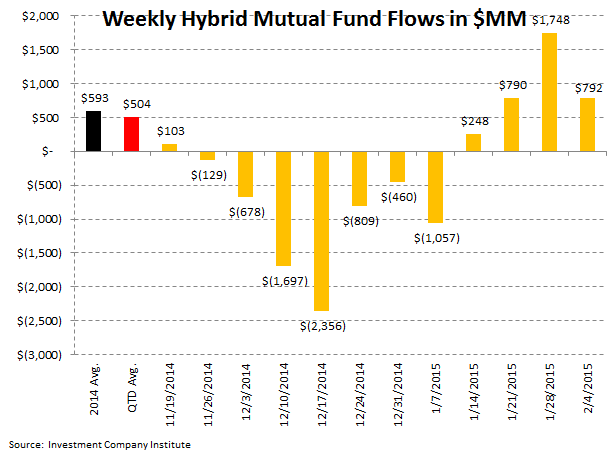
Most Recent 12 Week Flow in Millions by Mutual Fund Product: Chart data is the most recent 12 weeks from the ICI mutual fund survey and includes the weekly average for 2014 and the weekly quarter-to-date average for 1Q 2015:


Most Recent 12 Week Flow Within Equity and Fixed Income Exchange Traded Funds: Chart data is the most recent 12 weeks from Bloomberg's ETF database (matched to the Wednesday to Wednesday reporting format of the ICI), the weekly average for 2014, and the weekly quarter-to-date average for 1Q 2015. In the third table are the results of the weekly flows into and out of the major market and sector SPDRs:


Sector and Asset Class Weekly ETF and Year-to-Date Results: In sector SPDR call-outs, as energy stocks have been moving upward since their mid-January low, investors have followed with contributions into the XLE Energy ETF; in the 5-day period ending February 4th, investors contributed +$1.3 billion to the XLE, an +11% gain. The XLY Consumer Discretionary ETF experienced the largest percentage withdrawal for the week (-8%) as investors continued to reign in levered bets on the U.S. Consumer. That also makes the XLY the biggest loser for the year to date at -14% in flows.

Net Results:
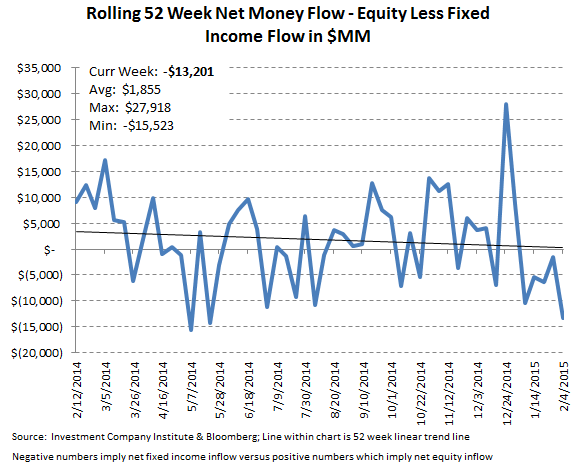
The net of total equity mutual fund and ETF flows against total bond mutual fund and ETF flows totaled a negative -$13.2 billion spread for the week (-$277 million of total equity outflow versus the +$12.9 billion inflow to fixed income; positive numbers imply greater money flow to stocks; negative numbers imply greater money flow to bonds). The 52 week moving average has been +$1.9 billion (more positive money flow to equities), with a 52 week high of +$27.9 billion (more positive money flow to equities) and a 52 week low of -$15.5 billion (negative numbers imply more positive money flow to bonds for the week).
Exposures: The weekly data herein is important for the public asset managers with trends in mutual funds and ETFs impacting the companies with the following estimated revenue impact:

Jonathan Casteleyn, CFA, CMT
203-562-6500
Joshua Steiner, CFA
203-562-6500
