“Storytelling is probably the single most popular recreational activity after sex and shopping.”
-Tham Kai Meng
Do you agree with that? Would your grandmother? How about Wall Street?
Interesting questions from a book I’m reading called The Ape, the Adman, and the Astronaut, by Ogilvy & Mather’s Chief Creativity Officer who claims that “the neuroscientists are saying your grandmother may have been right all along.” (pg 11)
Since I got crushed on Friday thinking that the US jobs report could be bad, I’m wide open to any story you’d like to tell me this morning. While I still think interest rates are going lower – storytellers make a market, after all.

Back to the Global Macro Grind…
To be, or not to be crushed (by counter-TREND moves) … remains the question. With the front-runner on big macro moves (the US Dollar Index) whipping around last week (down, then up), here’s what drove macro storytellers right batty:
- USD Down – during the front-end of the week, drove Oil, Russia, and Energy Stocks Up
- USD Up – on Friday’s jobs report, drove Rates, Utilities, and REITS down
These two story lines are not one and the same thing. And to have been properly positioned for both of them (while not getting your rear-end handed to you for 3-6 months prior) was next to impossible.
Summarizing the Down Dollar (then up fast on Friday) week:
- The US Dollar Index finished the week -0.1% at $94.70 (still +4.9% YTD)
- Oil (WTI) ramped +7.2% wk-over-wk to $51.69 (still -3.7% YTD)
- CRB Commodities Index had its 2nd up wk in a row, +2.7% to -2.2% YTD
- SP500 had its 2nd up wk in the last 6, closing +3.0% to -0.2% YTD
- Energy Stocks (XLE) led SP500 gainers, +5.7% wk-over-wk to +0.8% YTD
- Utilities (XLU) led SP500 losers, -3.6% on the wk (falling to -1.4% YTD)
That last part (Utilities Down) all happened on Friday with the #RateRising move where:
- UST 2yr Yields ripped to +0.64% (+19 bps on the wk, but -2 bps YTD)
- UST 10yr Yields shot up to 1.96% (+32 bps on the wk, but -21 bps YTD)
And it wasn’t just Utilities that flashed an immediate-term TRADE oversold signal on that. So did REITS (VNQ) and pretty much everything that I’ve liked on the long side of Fixed Income for the last year (TLT, EDV, MUB, ZROZ, BND).
The MSCI REITS Index was -1.6% on the week, but is still up +4.9% YTD and my story-line is that looks a lot like the P&L of the Long Bond bull. One down week does not a new intermediate-term TREND make.
To be balanced, the other side of the storytelling remains that US GDP growth is going to magically accelerate to +3-4% year-over-year, and that we’re going to get rainbows and puppy dogs delivered in every late-cycle employment report, throughout…
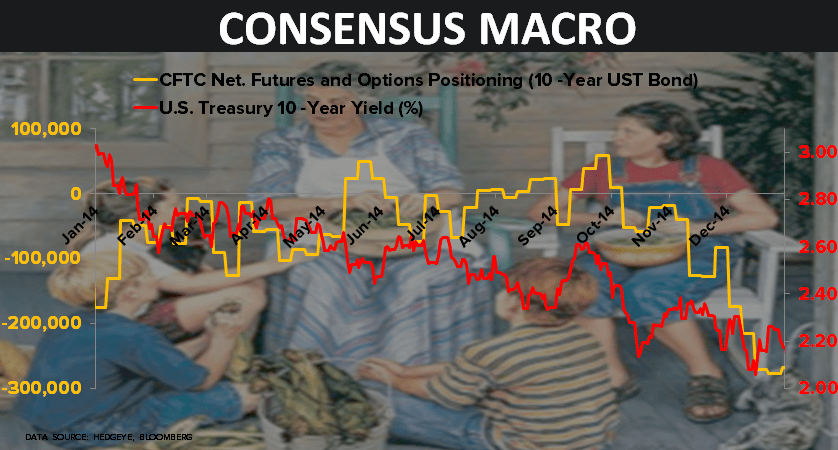
To a degree, Consensus Macro bets still agree with that – here’s the updated CFTC Futures/Options net positioning:
- SP500 (Index + Emini) net LONG position = +66,335 contracts (vs. the 1 yr avg of -10,119)
- Treasuries (10yr) net SHORT position = -145,402 contracts (vs. the 1yr avg of -65,444)
- Crude Oil net LONG position = +324,181 contracts (vs the 1yr avg of +365,957)
For 2015, unless you bought the lows, being long SP500 and commodity related beta has been painful, but consensus has worn it the whole way down inasmuch as it has suffered the under-performance pain of not being bullish on the Long Bond.
But maybe the story is different this time? Could rates finally be ready to rocket to the upside? After oil and its related equities have had their counter-TREND bounce, could they continue higher and be the inflation catalyst big equity beta chasers need?
I don’t think so. If I did, on Friday I wouldn’t have signaled (in Real-Time Alerts) to:
- Buy Utilities (XLU)
- Buy Municipal Bonds (MUB)
- Short Banks (BAC)
Opportunities to go shopping for bonds and/or stocks that look like bonds have been few and far between for the last 6 weeks. So I want to signal that you take advantage of one of the two “popular recreational activities” that grandma would sign off on!
Our immediate-term Global Macro Risk Ranges are now:
UST 10yr Yield 1.64-1.95%
SPX 1
VIX 15.67-21.44
USD 93.52-95.44
WTI Oil 42.89-54.02
Gold 1
Best of luck out there this week,
KM
Keith R. McCullough
Chief Executive Officer