
Market factors are contextualized differently based on our own trials and errors, experiences, and personal biases. As a sell-side independent research firm, we believe our process is positively differentiated with the active risk management overlay to our research. With this model comes the responsibility to consistently communicate and revisit this process.
Volatility in oil (and across asset classes for that matter), hit historic lows this summer at the highs in crude oil. The OVX index bottomed in June and reached its highest point yesterday since 2008.
The question then becomes, does the 3-day rip in energy prices and oil volatility starting last Friday support the case that oil has found real support in the $40’s?
We outlined the fundamental factors in the energy space moving to support prices, but the other side of our process tells us to fade this move for now. If history is any indication, two conclusions about prices and volatility in oil markets can be made:
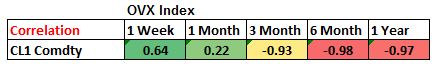
1) Volatility’s relationship with price looks very similar to equity markets. Volatility and price have a tight inverse correlation
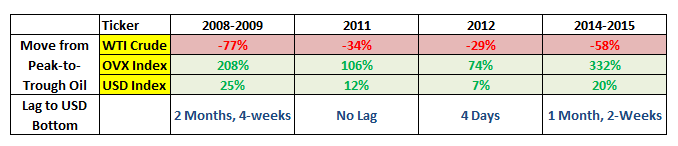
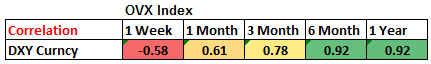
2) The U.S. dollar is a leading indicator for big turns in prices and volatility
Regarding the first point, the 3-month, 1-year, and 3-year correlations are straightforward between WTI and WTI volatility and also WTI vs. the OVX Index. The short-term reversal is a counter-TREND head-fake.

If you get the outlook for the U.S. dollar right you’ll get a lot of other things right. The dollar tends to lead turns in the oil market, as it has in each of the last four big downturns in oil. Our view on the outlook for the dollar is always communicated clearly (see this morning’s edition of the Hedgeye Macro Playbook for a refresher).
We covered our OIL SHORT position yesterday, our COPPER SHORT position today, and our USD LONG today. With the GDP miss and a preponderance of bad economic data, a bad jobs report tomorrow could be a catalyst for a near-term pullback in the U.S. dollar leading up to the Fed meeting in March.
The table below shows the performance of the U.S. dollar and OVX indices for the last four >20% peak-to-trough moves in oil along with a few supporting charts:
Looking at OVX vs. the USD, longer-term they are positively correlated. A USD break-out to the upside has never been met by a sustained pullback in OVX.
OVX vs. WTI vs. USD

Source: Bloomberg
3-Month WTI Volatility Index vs. Price

Source: Bloomberg
We sent our first short oil signal via OIL to RTA subscribers on Monday at $11.22 (3:22 p.m.). We were early and shorted more on Tuesday at $12.02 (3:15 p.m.) for an average cost basis of $11.62. The position was covered yesterday at $11.01 (3:44 p.m.).
We will continue to short on strength on these exhausted moves to the upside unless the model tells us differently (bottoms are processes, not points).
We anchor on price, volume, and volatility factors for market signals within intermediate to longer-term market TRENDs for generating buy and sell signals.
To use the example of oil, what we would want to see for bullish confirmation is:
- rising price
- rising volume and open interest; On the back of
- decelerating realized volatility; And,
- a deceleration in front-month implied volatility
Rising volatility on the up move against a counter-TREND move (down dollar within a BULLISH TREND) is a leading indicator of continued volatility and widening risk ranges (more downside on the move back down)
The following link is a clip explaining this process on yesterday’s morning macro call:
“Oil had an epic move to the upside but on increasing volatility (OVX). Rising vol. while prices are rising on a counter-trend move (Bad econ, dollar down, commodities up) is not a good signal. While trending implied volatility in S&P front-month VIX hasn’t broken its bullish trend (still bullish). A widening range is a leading indicator for rising volatility.”
We often reference widening volatility as a signal for widening risk ranges, but these are in some ways complements of one another.
When volatility is increasing, the exhaustion points on both sides of a market (resistance bands) are farther away from where it is currently.
More involved than just using standard deviation to bet on a reversion, the volatility assumption is key to modeling the probabilistic expectation for different price movements.
For our bearish bias to be changed we need what look like longer term resistance levels to break and hold (the intermediate and longer-term lines did not on last Friday or Tuesday’s move). the price reached the top-end of our IMMEDIATE-TERM risk ranges, we is why we blasted the sell signal to subs.
Our intermediate-term TREND line (3-months or more) in oil is up at $56.68. Unless oil can break that line and hold, we’re viewing it with an intermediate-term bearish bias, and we’ll short on green and cover on red. By modeling this longer-term TREND we don’t capitulate on our thesis based on the day-to-day battle between all the robots.

Ben Ryan
Analyst
