This note was originally published at 8am on January 22, 2015 for Hedgeye subscribers.
“If you die in the short run, there is no long run.”
-Larry Summers, offering a little reverse Keynes in discussing hysteresis & secular stagnation
If you stick your arms straight up over your head and hold them there, it’s impossible to stay angry. Seriously, try it.
I’m not sure what you do with that nugget of empirically derived kindergarten teacher insight, but it may serve as a nice low-intensity therapeutic post this morning’s central planning event or as you puzzle further over the prospects of secular stagnation.
Most mentions of secular stagnation in the financial press convey some vague notion of protracted ‘sub-trend’ growth due to an amorphous mix of lousy demographics and debt overhang.
Despite the indefiniteness with which the idea is typically delivered, people find it intuitively appealing and seem willing to (at least partially) accept it simply because it plausibly characterizes our current, collective experience.
In his 2014 address to the NABE, Larry Summers – who is credited with re-popularizing the term – presents a commonsensical and analytically tractable contextualization of the dynamics underpinning the secular stagnation thesis.
Notably, Summers argues that the entre into economic purgatory actually began some 15+ years ago and what we had formerly viewed as “normal” growth was largely an unsustainable outcropping of overly expansive policy.
Summers highlights recent expansionary periods across industrialized economies to illustrate the point:
- USA 2002-2007: “How satisfactory would the recovery have been with a different policy environment, in the absence of a housing bubble, and with the maintenance of strong credit standards.”
- USA 1995-2000: “there was very strong economic performance that in retrospect we now know was associated with the substantial stock market bubble of the late 1990s”
- JAPAN 1994-2014: “it is hard to make the case that over the last 20 years, Japan represents a substantial counterexample to the proposition that industrial countries are having difficulty achieving what we traditionally would have regarded as satisfactory growth with sustainable financial conditions.”
- EUROPE 1999-2005: “It is now clear that the strong performance of the euro in the first decade of this century was unsustainable and reliant on financial flows to the European periphery that in retrospect appear to have had the character of a bubble”
In short, Summers makes the case that the magnitude of growth in recent cycles overstated potential, was footed in a ‘sandy loam’ of loose policy, and would not have been achievable absent the associated increase in financial instability.
The fact that secular stagnation sits at the fore of the current macro discussion is simply because its realities become increasingly tangible at the lower bound in rates where policy becomes impotent in cushioning the blow of the financial instability it helped propagate in the first place. I encourage you to read and consider Summers proposition for yourself >> HERE
Meanwhile, Super Mario’s on deck with the latest currency war announcement out of the ECB this morning. With the alphabet soup of Eurozone stimulus programs to-date largely ineffectual in impacting the real economy, consensus sitting on an expectation for ~€600B in QE, and anything short of “unlimited” likely to be underwhelming, is the recent re-crescendo in interventionism more likely to propagate financial stability or volatility?

…….If Florida is heaven’s waiting room, Frankfurt is fast becoming the central bank triage center for #DeflationsDominoes as the multi-decade policy to inflate reaches its terminal end.
In other, less dismal news – we still like housing on the domestic macro front. We don’t like it at every time and price and don’t think the industry goes full escape velocity in the intermediate term but we do think the dynamics are such that it goes from 2014 underperformer to 2015 outperformer.
We detailed the thesis on our 12/16/14 Conference Call but understanding why we like housing in 2015 is, perhaps, most easily explained by why we didn’t like it in 2014:
- Taper + Tighter Credit: 2014 started with a thud as rates peaked into 2013 year-end and the twin terrors of QM (January 10, 2014) and lower FHA loan limits (January 1, 2014) constricted the underwriting box right out of the gate.
- Polar Vortex & Major Investor Retreat: Wicked weather capsized early-year demand while the end of the REO-to-Rental trade by private equity firms drove a substantial decline in both total volume and price uplift in select markets like Phoenix, Las Vegas, SoCal and much of Florida.
- Decelerating HPI: After rising at 11-12% year-over-year throughout the bulk of 2013, US home prices began to decelerate by March 2014 and continued to decelerate until just recently.
Looking forward, 2015 is essentially setting up as the obverse:
- Easy Comps: 2014’s collapse is the 2015 comp
- HPI stabilization: Housing related equities follow the slope of home price growth and HPI is stabilizing
- Expanding Credit Box: Lower FHFA down payment requirements, lower FHA premium costs, housing as a 2015 policy focus
- Lower Rates: Rates are nearly a half point lower than the 2014 avereage already. A 1% reduction in rates equates to ~10% increase in affordability
- Labor Market Improvement: Improvement remains ongoing and is picking up in key housing demand demographics.
Yesterday’s housing data offered further confirmatory evidence of firming demand and the trend toward improving rate of change as we head into the new year.
- Purchase Applications: Purchase demand registered a second week of positive year-over-year growth - the 1st weeks of positive growth since December of 2013 – accelerating to +3.7% in the latest week from +2.6% prior. Growth is currently tracking +9.2% on a QoQ basis.
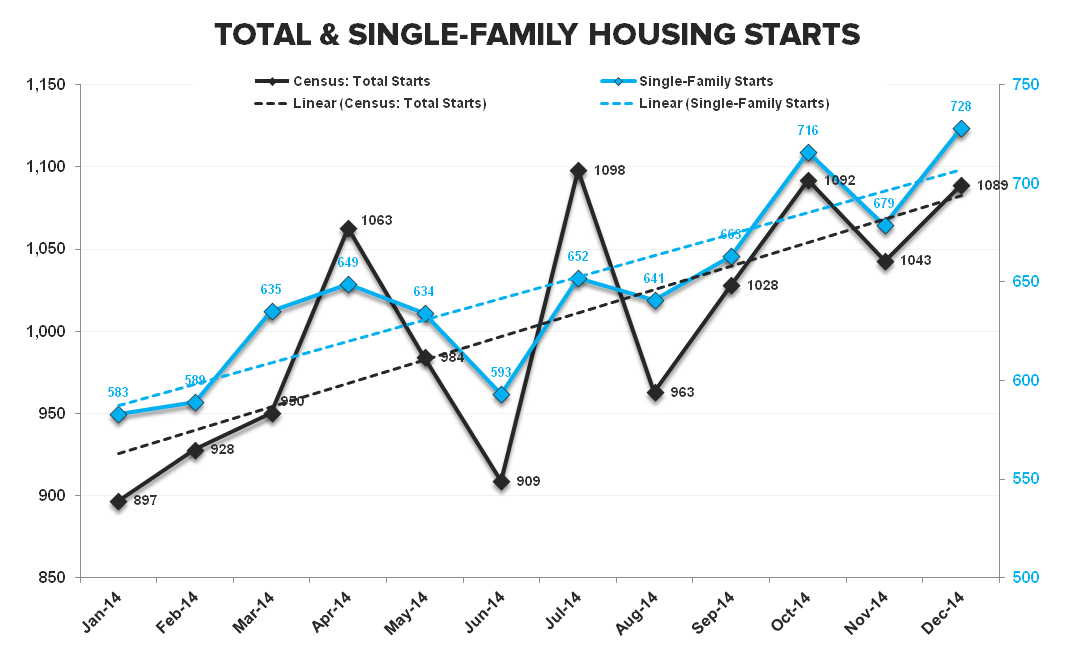
- Housing Starts: Total Housing Starts rose +4.4% to 1.089MM units in December with both October and November estimates revised higher. Notably, single-family starts rose +7.2% sequentially to +782K, the highest level since March of 2008. The Chart of the Day below shows the (improving) TTM trend in Housing Starts.
To close, the current challenges faced by policy makers remain acute. Investors tasked with front-running reactionary policy measures and discounting their prospective impacts and collateral damages remain equally challenged. Neither condition is particularly amenable to a proverbial raising of the arms type remedy.
“You don’t really know how tall you are until you have your back against the wall”
….that’s another axiomatic gem I picked up along my short stint on the kindergarten teaching circuit. It seems fitting.
Our immediate-term Global Macro Risk Ranges are now:
SPX 1987-2040
VIX 16.66-23.07
EUR/USD 1.15-1.19
WTI Oil 44.96-49.85
Gold 1251-1312
Copper 2.48-2.64
To (sustainable) growth,
Christian B. Drake
U.S. Macro Analyst